Being a digital
agency owner is tough—you bear lots of responsibility for your clients' online successes and failures. And that means that wearing multiple hats is the name of your game.
Why aren't these landing pages converting at the rate they're supposed to?
"Let me get with my team, and we can diagnose the problem."
How come none of our campaigns are driving significant website traffic?
"We should adjust the target audience and tweak a few ad parameters."
What types of content should we focus on for our upcoming product launch?
"Let's consider competitors' actions and the platforms we're having the most success with and determine which strategies work best for our product."
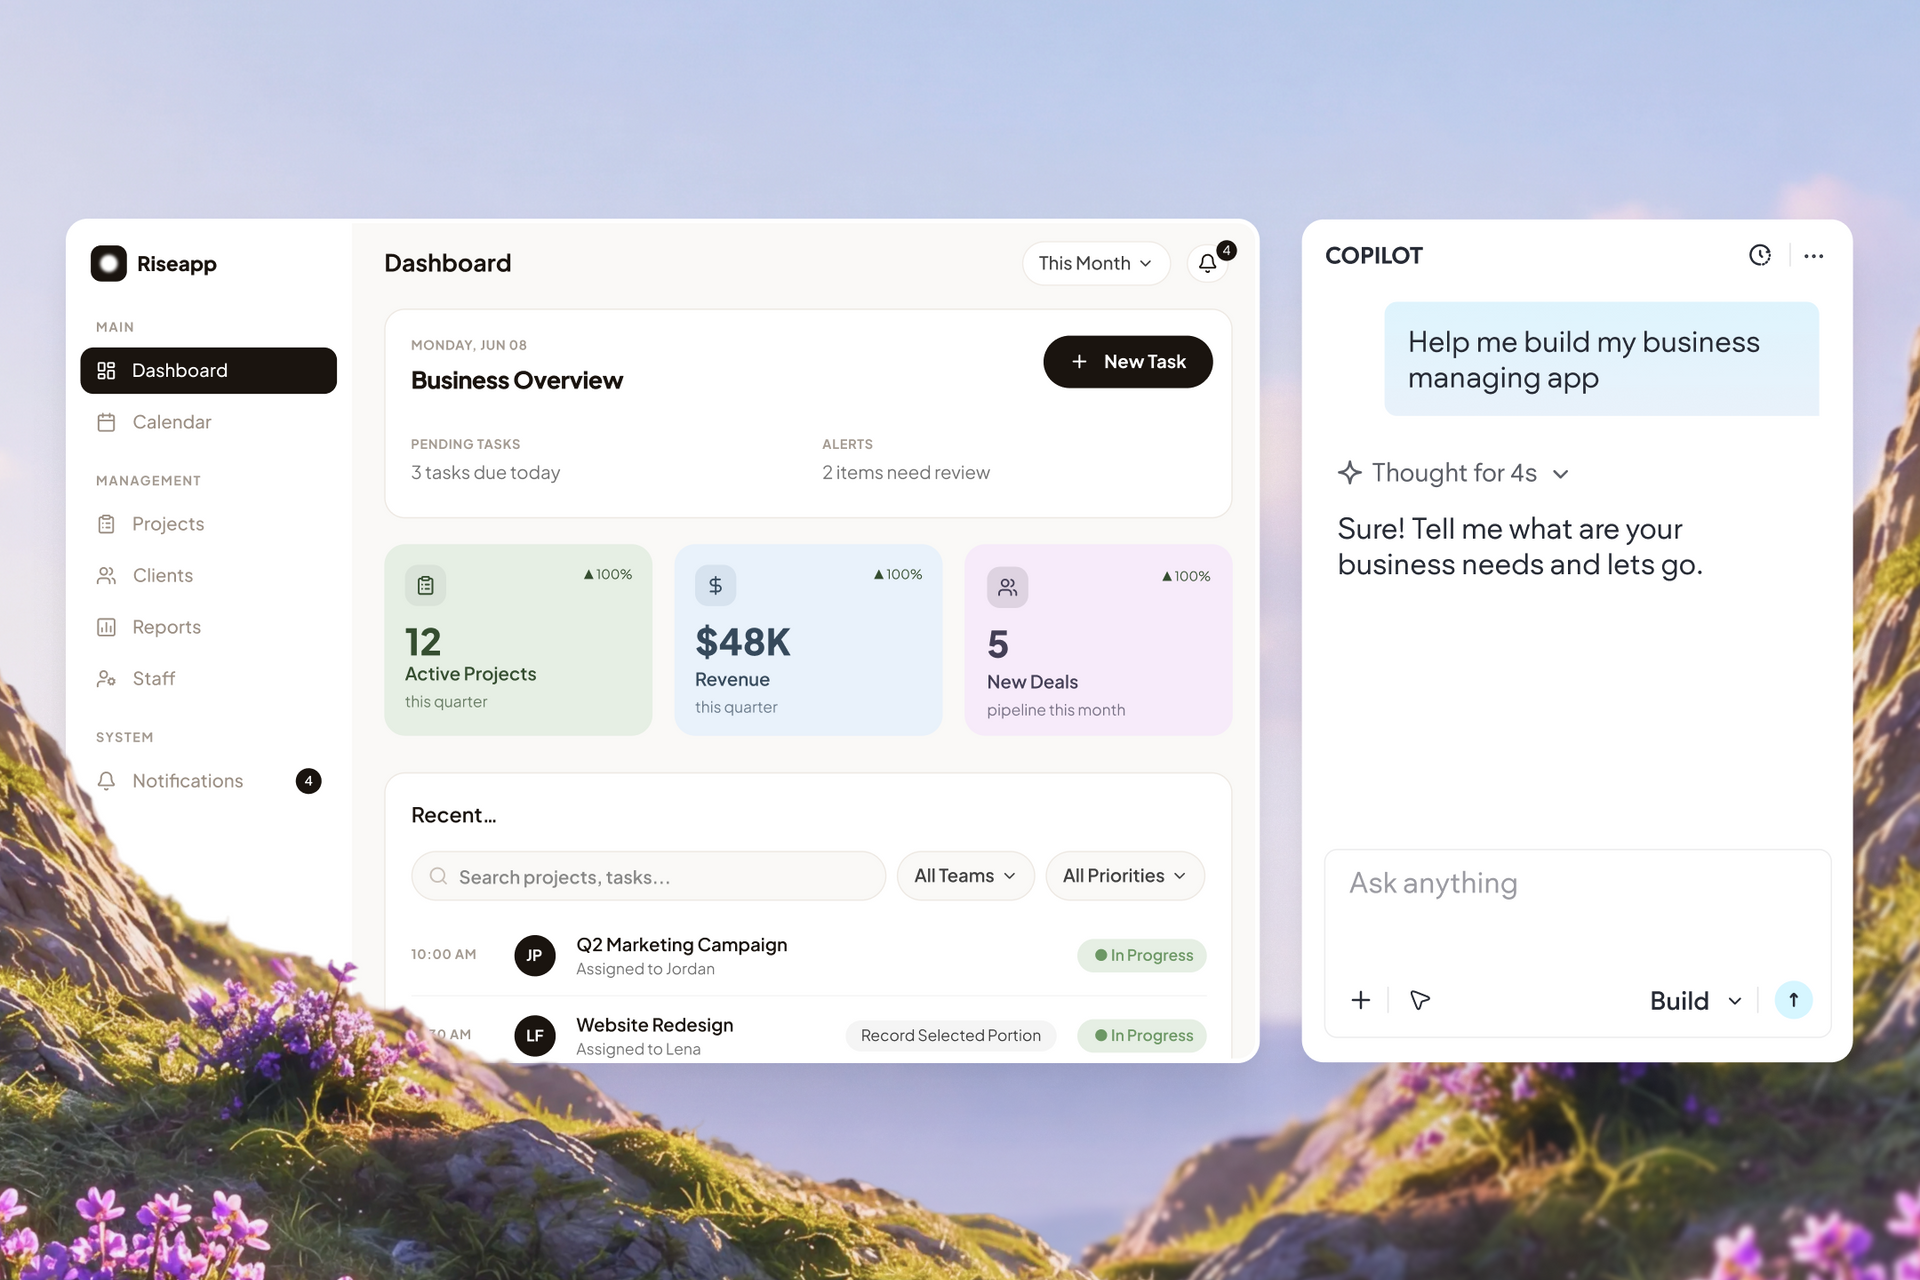
These sound like straightforward requests, but it's hard to make informed decisions without data to back up your hypotheses. And if you want to
build strong client relationships, you'll need to give them
client reports that are accurate, insightful, and demonstrate your value.
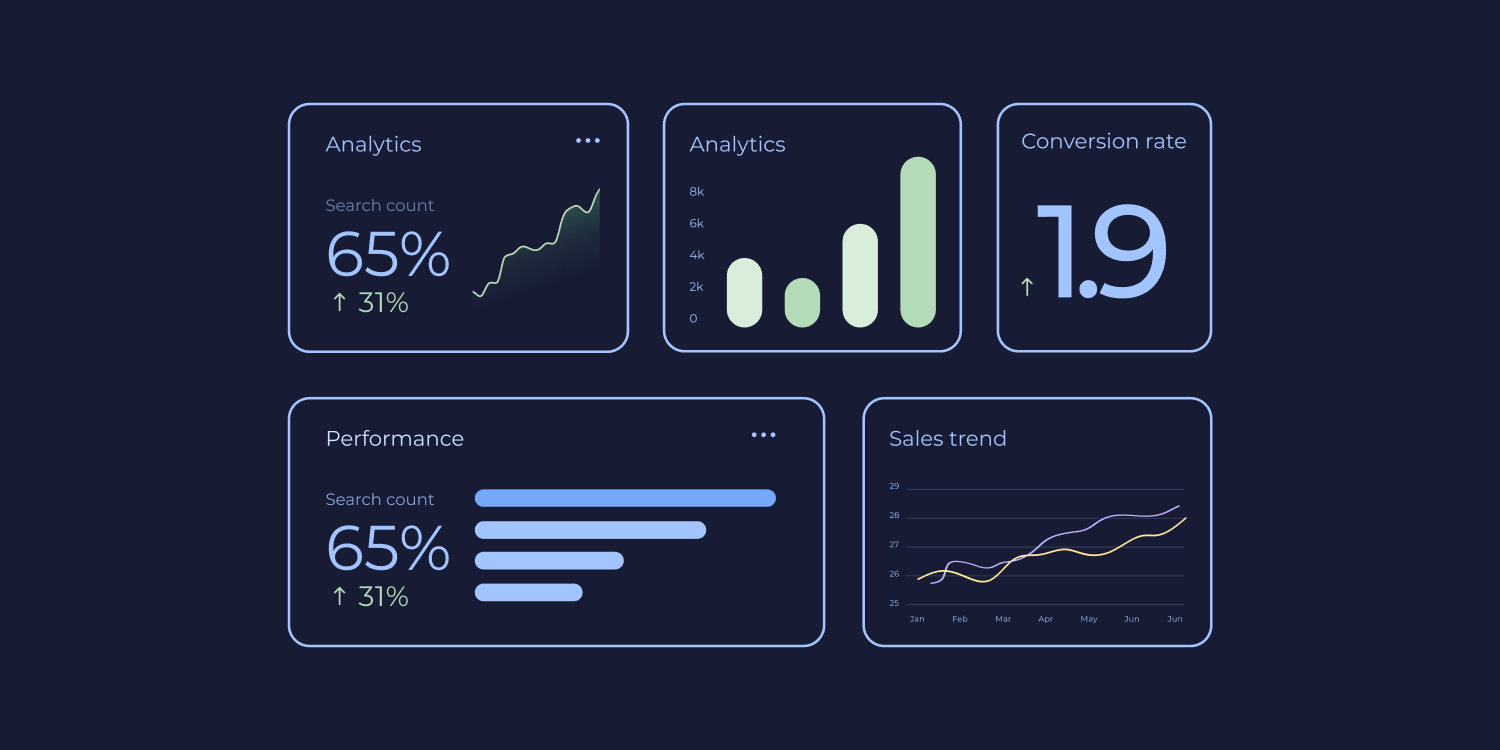
The good news is that you can use website KPIs as a North Star for generating data-driven solutions on behalf of your clients. In this article, we’ve outlined the top 20 KPIs to measure your clients' online performance and guide their success.
THE 3 TYPES OF WEBSITE KPIS
To make things easier, we've grouped all website KPIs into three general categories:
- Acquisition KPIs: These KPIs measure the traffic coming to a website from outside sources. Traffic can include organic, direct, referral, and campaigns.
- Engagement KPIs: Engagement metrics can monitor user behavior such as page views, time on site, scroll depth, video plays and more. You can use them to measure how long people are spending on your client's website and where they are engaging the most.
- Conversion KPIs: Conversion KPIs measure whether or not visitors to the website take a desired action, such as downloading an ebook, signing up for a newsletter, or making a purchase.
HOW CAN I CHOOSE THE RIGHT KPIS TO MONITOR?
There are seemingly endless ways to gauge website performance. And if you try to track everything, you and your clients will both be lost in the clutter.
To decide what to track, ask yourself the following questions:
Is this KPI quantifiable?
To make sense of your client's web analytics, you need to be able to measure progress over time.
A quantifiable KPI is expressed in terms of numbers, such as page views, time on site, or number of sign-ups.
The reason you don't want to track non-quantifiable metrics is that they don't provide an easy way to measure success.
For example, you can't measure the success of a website's design, per se. But you can measure the success of its user experience in terms of how often people click through to other pages.
Does this KPI indicate success toward a goal?
It's important to set the right KPIs that align with your client's objectives. If you are working with an eCommerce store, then tracking sales will be essential. But if you are helping a content-based website grow its reach, then page views and social media shares might be more appropriate.
To answer this question, you'll need to dive deep into your client's current goals, their stage of growth, and their target audience.
Is this KPI essential to my client's success?
Since tracking too many KPIs can lead to data overload (and confusing Google Analytics dashboards), it's important to focus on the essentials. Identify the 5-8 website metrics that are necessary for your client to reach their company's business goals.
Ask your client what their ultimate objective is, and then map out the KPIs that will provide the data you need to reach it.
20 Best KPIs for Measuring Client Website PerformancE
Now that we've discussed the basics of choosing website KPIs, let's look at 20 of the best practices for tracking web performance.
1. Page Load Time (Page Speed)
At Google, users come first. And
half of your client's website visitors will leave if the site takes more than six seconds to load. So Google rewards fast-loading websites with higher search engine rankings.
Also, your clients' sites' conversion rate is greatly
impacted by the site performance.
Using Google's
PageSpeed Insights tool, you can check the load speed (and several other credentials) of any website for free—all you have to do is copy/paste the URL.
2. Page Views
Page Views measures the number of pages on a website that have been viewed. This metric provides insight into how often users engage with the site and their level of interest in its content.
It's important to note that Page Views doesn't pertain to marketing or website traffic. Instead, it shows how users interact and behave when on your site. Consequently, it's a critical metric for managers and stakeholders who need to see user engagement and retention rates.
The complete Page Views report can be found in Google Analytics by going to the
Audience >
Overview section.
3. Unique Visitors
Unique visitors are individuals who interact with your client's website for the first time. This metric can be used to measure overall website traffic, as well as the impact of marketing campaigns and promotional activities.
Measuring your client's unique site visits can inform a few different things:
- How well the website's content resonates with its audience
- Whether or not users are returning to the site
- Which sources of traffic are bringing in new visitors
Unique visitors are counted by Cookies (not IP addresses) and are tracked in Google Analytics under the
Audience >
Overview section. The default analytics dashboard usually includes it as well.
4. Users & New Users
Cross-referencing your new users to your total users over a time period will show you the rate at which your client's website is growing.
A high number of returning users can also indicate that visitors are finding the content useful and engaging.
This metric is also tracked in Google Analytics under both the
Audience >
Overview section and
Acquisition >
All Traffic section.
5. Traffic Source
Understanding where your clients earn their site traffic is essential for assessing user engagement, identifying new content marketing opportunities, and measuring the success of targeted campaigns.
Especially if you're working with eCommerce brands, this performance metric is essential.
A few traffic sources to measure include:
- Social Media: Which platforms are driving traffic to your client's website?
- Organic Searches: Are they ranking in the search engine results pages (SERPs) for their target keywords?
- Direct Traffic: Are users coming directly to the site from links or bookmarks?
- Referral Traffic: Who is referring people to the website?
- Email: Are newsletter campaigns driving traffic to the site?
Google will tell you which sources drive the most traffic to your website under the Acquisition section. You can use this data to track PPC, SEO, email, and social media marketing campaigns.
6. Organic Traffic
Whether or not you manage SEO for your clients, organic traffic can be an invaluable metric. It can help identify opportunities to refine their content, optimize their website for search engine rankings, and understand what topics resonate with their audience.
By measuring the number of users who naturally visit your site via search engine results pages (SERPs), you can get an idea of how well the website performs in terms of keyword optimization and content relevancy.
You can use the same
Acquisition report to see organic traffic, as it is nested in the same section as all other traffic sources.
7. Sessions
A "session" is a metric that measures the total number of interactions users have with your client's website within a designated time frame. A single session could include multiple page views, downloads, and adds to a shopping cart.
This performance indicator can give you an idea of how many times the website was used in a given period of time. It can also indicate which pages are most popular with users, how quickly they abandon the website, and which sources drive the highest engagement rates.
You can use this information to create targeted campaigns, refine content, and optimize the user experience.
8. Pages Per Session
When users go through multiple pages in a session, it can mean two things:
- Users are engaged with the site and exploring its content.
- Visitors can't find the needed information and are bouncing from page to page.
Using this metric with other KPIs like time on page, bounce rate, and exit pages can help you get a full view of what users are doing when they visit the website.
9. Conversion Rate
When it comes to website KPIs, the conversion rate is the holy grail. It helps you show your clients exactly where you're making them money and where there's room for improvement. and where there's room for improvement.
To measure this metric, you'll need to define the goal—it could be a newsletter sign-up, a purchase, or anything else that indicates success on your website. Then use Google Analytics to track how many users actually follow through with that action (goal completions).
For eCommerce websites, Google Analytics can even compare website sessions and users to the number of transactions they completed.
By breaking down these conversions by source and other performance indicators, you can assess which campaigns are most successful and how to improve them.
10. Goal/Events Completions
On top of conversions, you can set goals and events in Google Analytics to measure how users interact with the website.
For example, if you want to see which content resonates most with your audience, you could create a goal for page views or downloads. Or, if you want to track user engagement on social media campaigns, you could set up an event for link clicks.
These goals and events can help you measure user behavior, identify trends, and optimize your client's website for maximum engagement.
11. Average Time On Pages
Average time on page is one of the easiest website KPIs to track. It shows how much time users spend viewing a particular page before clicking away or moving onto another page.
Since it doesn't give you the full picture of what impacts your client's bottom line, this KPI is best used with other metrics, such as bounce rate, page views, and goal/event completions.
12. Average Session Duration
Average session duration is a great way to measure how users engage with the website. It can help you determine which pages successfully keep visitors on the site and which ones could use more work.
Using this KPI, you can also identify which pages keep users engaged for longer periods of time.
If you find that certain content is disproportionately driving traffic or has a higher average session duration, you can use that information to refine your content strategy and suggest new content ideas to your client.
13. Bounce Rate
Track this KPI religiously. Your clients will love you for it.
If people are clicking on a client’s site and leaving shortly thereafter, it’s always cause for investigation. If tons of users leave your client’s page, they aren’t ranking, and their customers aren’t buying.
Bounce rate measures how quickly users leave a website after viewing just one page. The lower the bounce rate, the better—it means that users interact with more pages and engage more deeply with your content.
And reducing their bounce rate can give an immediate boost to search rankings and conversion rates.
14. Top Performing Landing Pages
Landing pages are one of the most effective ways to funnel in new leads for your client's website. You can identify which pages outperform the others by tracking which landing pages get the most traffic and conversions.
You can also use this data to optimize existing pages or create new ones that draw in more leads and conversions.
You can measure landing page success in a few ways:
- Create goals in Google Analytics to track how many users complete an action (e.g., signing up for a free trial),
- A/B test different versions and elements of the landing page (e.g., CTAs, copy, colors, clickable assets),
- Track the click-through rate (CTR) and time on page for different landing pages and compare them.
15. Exit Rate + Top Exit Pages
Exits and entrances differ from site visits and page views.
An entrance happens when someone first visits your client's site, and the entrance rate is equal to the number of times a specific page was the first page in a session.
An exit occurs when someone leaves your site after browsing, and the exit rate for each page equals the number of times it was the last page in a session.
To find out where users exit the site, you'll have to use the Explore feature and create a free-form exploration of exit pages. Then, you can compare them to your top-performing pages and look for trends or anomalies in the data.
16. Dwell Time
Dwell time is the length of time someone spends on a page after entering through an organic search.
To find your average dwell time in Google Analytics, simply look at the "Average Session Duration." This metric tells you how long users stay on a website on average and is measured by the total duration of all sessions (or visits) divided by the number of sessions.
17. Scroll Depth
Agency owners measure scroll depth to determine how far visitors scroll down the page. It's a great way to understand what content resonates with your readers and which parts of the page are more engaging than others.
You can track this KPI by adding a tracking code to specific website sections or using a heat map tool like
Hotjar or
Crazy Egg.
18. Interactions Per Visit
Interactions per visit, or IPV, is an excellent metric to use for forms. It tells you how many times, on average, visitors interacted with a page before submitting it.
Using Google Analytics, you can measure this KPI by tracking data from your form submission pages. This will allow you to see which fields see the most interactions, so you can optimize them accordingly.
If you want to measure interactions for other kinds of pages, you can use Google Analytics's event-tracking features.
19. Site Search Queries
An often overlooked (and much more abstract) KPI is site search queries. Using Google Analytics, you can analyze how users interact with your website's search bar and what content they're looking for.
You can also track conversions related to site searches and use the data to improve calls-to-action, optimize pages, and craft better content.
Google has an in-depth tutorial on how to set up Site Search.
Click here to read it.
20. Cost Per Lead (CPL)
CPL is a bit broader than your everyday website KPIs, but it's still important to measure.
You can't use Google Analytics to monitor it, but you can use Google Analytics to cross-reference conversion rates and values with Google AdWords and search engine data. That way, you can use the data to determine how much your client spends per lead (or customer).
By showing them exactly how much they are spending per lead with a website KPI-based breakdown, you're more than just an agency service provider—you're a partner in their success.
THE BOTTOM LINE
These are just a few website KPIs you can use to measure your client's site performance and give them an edge over their competitors. You can leverage these numbers, values, and data to create unique reports that show clients exactly how much they're getting from their website investments.
There's no one-size-fits-all approach when it comes to KPIs. Every company has distinct business objectives, and a true digital marketing expert can take these simple numbers and weave them into creative, actionable strategies that get the results their clients need.
To measure website KPIs for your clients, you need to build killer websites for them first. Click here to start with a free trial!
Related Posts
By Ilana Brudo
•
June 16, 2026
Maximize agency ROI in 2026: Automate onboarding, billing, SEO, and reporting to empower your team to focus on strategy and growth.
By Shawn Davis
•
June 11, 2026
AI is transforming search into direct, on-device answers. Learn why AEO is essential for your clients’ local visibility.
By Mike Paciello
•
May 19, 2026
The web had its worst accessibility year in six. On GAAD's 15th anniversary, learn why the 2026 regression is a process problem and how Duda and AudioEye help agencies fix it.
Show More