If your
agency is like most, client reporting is a big part of your weekly routine. In fact, according to
Wordstream's 2019 State of the Internet Marketing Agency in 2019 report, 59 percent of respondents spend at least an hour on client reporting each week.
If you’re managing 20 clients, then do the math - that’s a lot of time spent on client reporting.
And there's a good reason why agencies invest so much time in client reporting; it is an essential part of the agency's activity. It helps agencies keep their finger on the pulse of their client's business, track progress against objectives, and identify areas for improvement. Not to mention they get to show off their work, which is as valuable as actually doing the work.
The only problem is… It’s kind of a drag, all these reports. Even if it’s only monthly reports.
While client reporting may seem like a daunting task, it doesn't have to be. With a little planning and organization, you can streamline your client reporting process and workflow and make it more efficient.
In this guide, we'll show you how to do just that. We’ll walk you through the what, why, and how of client reporting.
Let’s start with the what…
What is client reporting?
Well… it’s exactly what you think it is.
Client reporting can be defined as the process of providing feedback and data on a regular basis to clients about the progress and results of their projects. Client reports can take many different forms, from spreadsheets to dashboards and presentations, but they all serve the same purpose: to keep clients informed about what is happening with their project and how it is progressing.
But they are so much more than that.
Client reporting is a powerful tool that opens a door for transparent client communication and discussions between you and your clients. It’s an important aspect of building a solid agency-client relationship.
There are additional reasons, of course, why client reporting is important (and sometimes crucial) to agencies, which brings me to my next point.
The Why - The Significance of client reporting
O.k, so generating marketing reports is important to cultivate healthy client relationships, and to interact with your clients regularly, what else?
Buckle up, there are many other reasons why marketing agencies just can’t do without them:
- Presenting your clients with your agency’s work - I briefly touched on this issue above, but it’s so important that it deserves its own section. Client reporting allows agencies to show their clients (new clients included) the value of their work. By providing clients with reports that show the results of their marketing campaigns and PPC campaigns, social media efforts, client’s goals and KPIs (key performance indicators) and more, agencies can demonstrate the impact of their work and prove their worth.
- Tracking progress - This data is essential for understanding whether or not your agency is meeting its goals.
- Keeping you and your clients accountable
- It's time to get accountable. Keeping yourself and your clients accountable will help ensure that everyone is on the same page.
- Providing transparency - client reporting can also be a valuable tool for agencies to build trust and transparency with their clients.
- Educating your clients -
your clients are probably not experts in marketing strategy, but it’s important they’ll have enough understanding to follow your lead and make strategic decisions.
- Identifying areas for improvement -
whether it means finding new ways to reach your target audience or tweaking your approach to get better results, client reporting is a practical tool to identify areas where an agency needs to improve and where to focus optimization efforts. This feedback is critical for making sure that your agency is providing the best possible service to its clients.
- Giving your agency a competitive edge - good reports are a way to differentiate your agency from competitors.
Speaking of good reports, let’s review some tips and best practices that will help you produce reports that are that good.
The How - Tips and best practices for successful client reporting + where to find good marketing templates
By following these best practices, you can create client reports that are both informative and easy to understand. Remember, effective reporting is key to maintaining strong client relationships - so take the time to do it right!
Ho, and If you’re looking for some marketing report templates, HubSpot has a decent selection of
templates here (excel). Of course, you’ll have to tweak it to your and your client's needs, but as a starting point, not bad.
Whether you are tweaking the above templates or creating client reports from scratch, I would read the below best practices and tips if I were you:
Define your client reporting process and keep your client in the loop - The first step to streamlining your client reporting is to define your process. What information do you need to include in your reports? How often will you produce reports? Who will be responsible for creating them? Answering these questions will help you develop a client reporting process that works for your agency.
The client is your target audience
- make sure you're clear about what the client wants to see. There's no point in including information that isn't relevant to them.
- Gather much-needed information -
It's important to gather all the relevant information from the client before starting to put together the report. This includes things like their goals, objectives, target audience, etc. Having this information upfront will make the report more focused and tailored to the client's needs.
Related:
Got A New Web Design Client? Ask These 10 Essential Questions
- Set expectations -
Your client should know what kind of report they're going to receive, how often they'll receive it, and what information will be included.
- Use data selectively, but tell a story:
including too much data can overwhelm your client and make it difficult for them to see the big picture. Only include the most relevant data points and leave out anything that isn't absolutely essential. However, use data to tell a story. Client reporting should be about more than just presenting data. It should be about using that data to tell a story that will help your client make informed decisions.
Generate reports that can be used many times and automate as possible -
There's no need to reinvent the wheel every time you create a client report. Automate as much of the process as possible by using reporting templates and possibly even reporting tools and software. This will save you time and ensure that your reports are always accurate.
- Automate, but also personalize the reports -
Don’t forget who you’re speaking to. Always personalize your reports. This means addressing your client by name, tailoring the report specifically to their needs, and using language that is appropriate for them.
- Make the reports cross-channel
- your reports should include data from all of the marketing channels where you're active - social media, email, paid advertising, etc. - not just one or two. Including data from all of your channels will give your clients a more complete picture of their marketing efforts and how they're performing.
- White label if possible -
White labeling the reports will give them a professional look and feel, and help build trust with your clients.
Related:
Top 9 White Label Tools For Agencies
- Make them short and sweet -
client reports don't need to be long and drawn out. Get to the point and provide the information that's most important to your client.
- Stay on schedule - Client reporting can be time-consuming, so make sure you plan ahead and stay on schedule.
Facts, facts, facts - Avoid using flowery language or long, drawn-out sentences. Stick to the facts and get straight to the point.
- Choose the metrics that matter most for the client's business
- Before you start client reporting, you need to decide which metrics you're going to track. This will vary depending on the business and what's important to your clients. However, some common metrics include website traffic, CTR, conversion rate, leads generated, etc. It’s also a good idea to agree with your clients on important metrics and KPIs prior to producing the report.
- Be honest
- If something isn't going well, don't try to hide it - be upfront and offer solutions.
- Make reports readable and simple - Your client should be able to understand the report without needing a degree in data analysis.
- Use precise and short copy - be sure to keep your reports clear and concise. Use bullet points and short paragraphs to make the information easy to digest and don't forget to proofread your work before sending it off - small errors can reflect poorly on your professionalism.
- Use context for stats and charts presented - make sure to include context for any stats and charts presented. This will help your clients understand what they're looking at and how it relates to their overall goals.
- Utilize data visualization as much as possible
- Not all clients are the same. Client reports should be easy to understand at a glance. Use charts, graphs, and other visuals to make your data more digestible.
- List next steps, action items and recommendations - Your client is looking to you for guidance on how to improve their digital marketing efforts. Be sure to give them actionable advice that they can use to improve their campaigns.
- Make room for an honest conversation - It’s not just about you, it’s also about the client. Make sure you open up the reporting process for feedback and questions and be ready to answer as needed. On that note, Be open to criticism and changes.
- Give clients access to the data -
In addition to client reports, give clients access to the raw data so they can explore it further on their own. This way, they can really dig into the data and understand it in depth.
- Use top client reporting tools - There are a number of great client reporting tools out there that can save you time and make your reports more accurate. We’ve already done the research for you and gathered a list of recommended tools you can choose from. That will be our focus for the next section.
Top Client Reporting Tools
Client reporting software will help you save time, gather and analyze data, create reports, & reporting dashboards and track progress over time. From all-in-one solutions to those specializing in specific areas like social media monitoring or SEO tracking, there’s a client reporting tool for every need.
And with so many client reporting tools to choose from, it can be difficult to know which one is right for your business. But with this list of the top client reporting tools, you’re sure to find the right fit for your needs.
- Agency Analytics
- Agency Analytics is an all-in-one client reporting solution that offers features like automated client reporting, client portals, and white-label branding. This tool also integrates with Google Analytics, Bing Ads, and Facebook Ads.
- Raven Tools - Much like Agency Analytics, Raven Tools says it has everything an agency needs for client reporting in one place. It offers a wide range of features, including social media monitoring, keyword research, link-building tools, competitor research and more. One unique feature is its ability to create proposals from templates— that’s pretty awesome!
- Google Analytics - No client reporting tool list would be complete without mentioning Google Analytics, the most common reporting tool out there— especially if your agency offers web design or development services. This is the place to gather insights into your client’s website traffic, conversion rates, and more.
- DashThis - Specializes in visual reports, especially beautiful, customizable dashboards, DashThis offers features like drag-and-drop report builder, data filters, and custom branding. In addition, it integrates with popular business intelligence tools like Google Analytics, Tableau, and Looker.
- Databox - Databox is another great option for visual reporting. It offers a wide range of integrations, templates, and customizations. Databox also has a mobile app so you can keep tabs on your client reports while on the go.
- Klipfolio - Klipfolio allows users to create custom reports and dashboards to track their progress and performance against their goals.
- Megalytic -
Megalytic is an all-in-one client reporting solution that offers features like automated reports, client portals, and white-label branding. This tool also integrates with Google Analytics, Bing Ads, and Facebook Ads.
- NinjaCat - NinjaCat is a client reporting tool specifically for the digital marketing industry. It offers features like social media monitoring, seo reporting, and website analytics. NinjaCat also has a wide range of integrations, including popular CRM tools like Salesforce and HubSpot.
- Mention -
Mention is a great client reporting tool for agencies that offer PR or social media services. Why? Because its specialty is monitoring your client brand’s online reputation, offering features like real-time alerts, social media monitoring, and competitor analysis.
- Quintly - Quintly is a client reporting tool that helps you track your client’s social media performance. It includes features like data analysis, report generation, and custom dashboards.
- TapClicks -
TapClicks is yet another client reporting tool that provides users with valuable insights into their marketing campaigns. It offers a variety of features that make it easy to customize reports, including the ability to add logos and branding, customize the layout and design, and choose from a variety of data sources. In addition, TapClicks offers a number of integrations that allow you to connect to other software platforms, making it easy to get the data you need into TapClicks.
- Whatagraph - Whatagraph is so useful. It helps you automatically generate reports from your client’s data. It includes features like data analysis, report generation, and tracking progress over time.
- NapoleonCat - NapoleonCat is a client reporting tool that helps users track their social media performance. It provides detailed reports on your social media activity, including data on engagement, reach, and more.
- ReportGarden -
ReportGarden makes it easy for digital marketing agencies to manage and track their client's progress. It provides agencies with customizable reports, dashboards, and analytics to help them make data-driven decisions. But the cool thing is ReportGarden also offers a client portal where clients can log in and view their progress reports.
- Metrics Watch - This tool enables you to track key metrics and generate reports that can be shared with clients. It also offers a range of features for managing projects and teams.
- Datapine - Datapine helps digital agencies keep track of their client data. With this tool, agencies can create reports and dashboards that help them make sense of all the data. And… they make it super easy for agencies to customize these reports and dashboards. This way, they can tailor the information according to their clients' needs.
- DashClicks - A suite of client reporting tools that are second to none, DashClicks allows agencies to track every aspect of their campaigns and see exactly how they're performing, as well as see which areas need improvement and make changes accordingly.
Final Note
From understanding its significance to implementing best practices to exploring tools, there’s an art to client reporting. In this article, we made it our goal to help you master that art.
However, as an agency owner, you should also follow your gut. You are the one communicating with your clients. You’re the one who knows them. So you have the best intel on what they would appreciate seeing and how they would like to see it.
Related Posts
By Ilana Brudo
•
June 16, 2026
Maximize agency ROI in 2026: Automate onboarding, billing, SEO, and reporting to empower your team to focus on strategy and growth.
By Shawn Davis
•
June 11, 2026
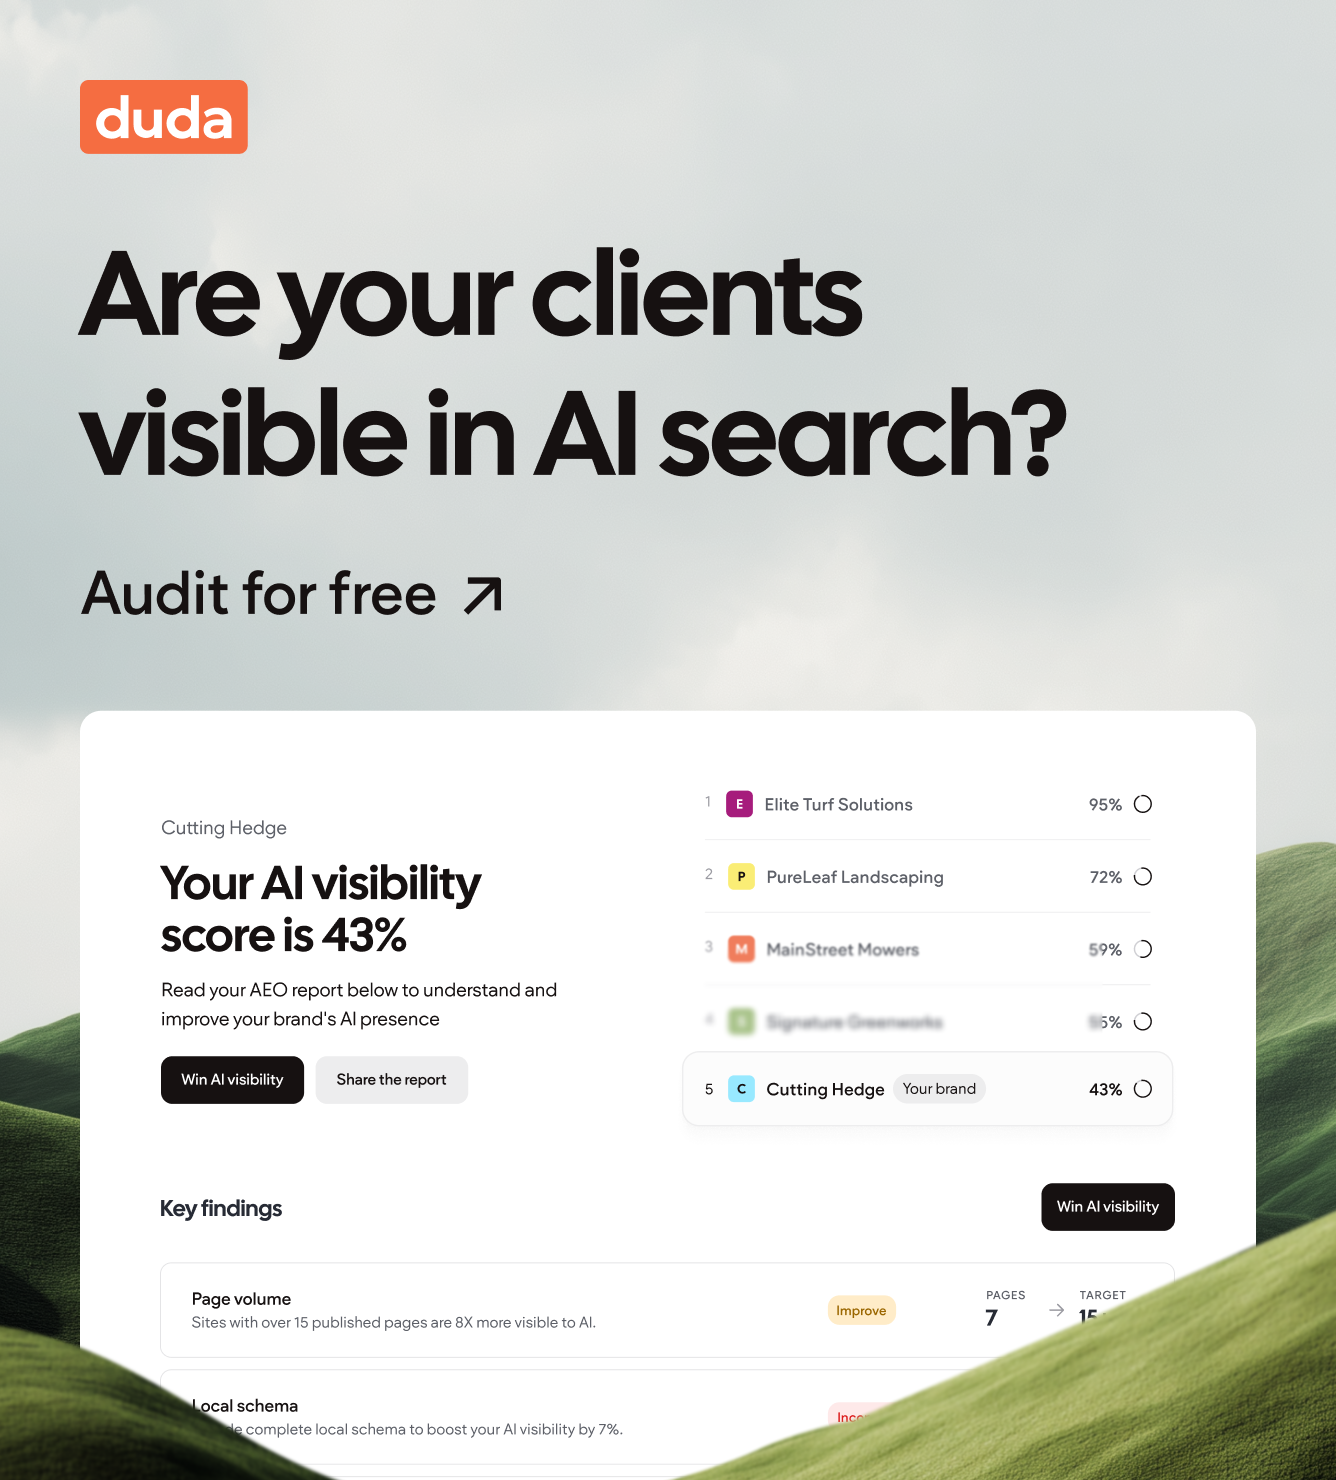
AI is transforming search into direct, on-device answers. Learn why AEO is essential for your clients’ local visibility.
By Mike Paciello
•
May 19, 2026
The web had its worst accessibility year in six. On GAAD's 15th anniversary, learn why the 2026 regression is a process problem and how Duda and AudioEye help agencies fix it.
Show More