In an industry that is forecasted to grow to $145.3B this year (Gartner), the competition is fiercer than ever. In order to keep up as a
SaaS provider you need to
grow at a certain pace. There are so many metrics you can track to keep tabs on the performance and growth of your company, especially in the SaaS world.
Strategic planning, accurate performance predictions, and actionable improvements in business processes come from being selective about what you decide to measure rather than trying to measure everything. This article rounds up a list of top metrics to consider for your SaaS business in 2022.
SAAS METRICS WORTH MEASURING
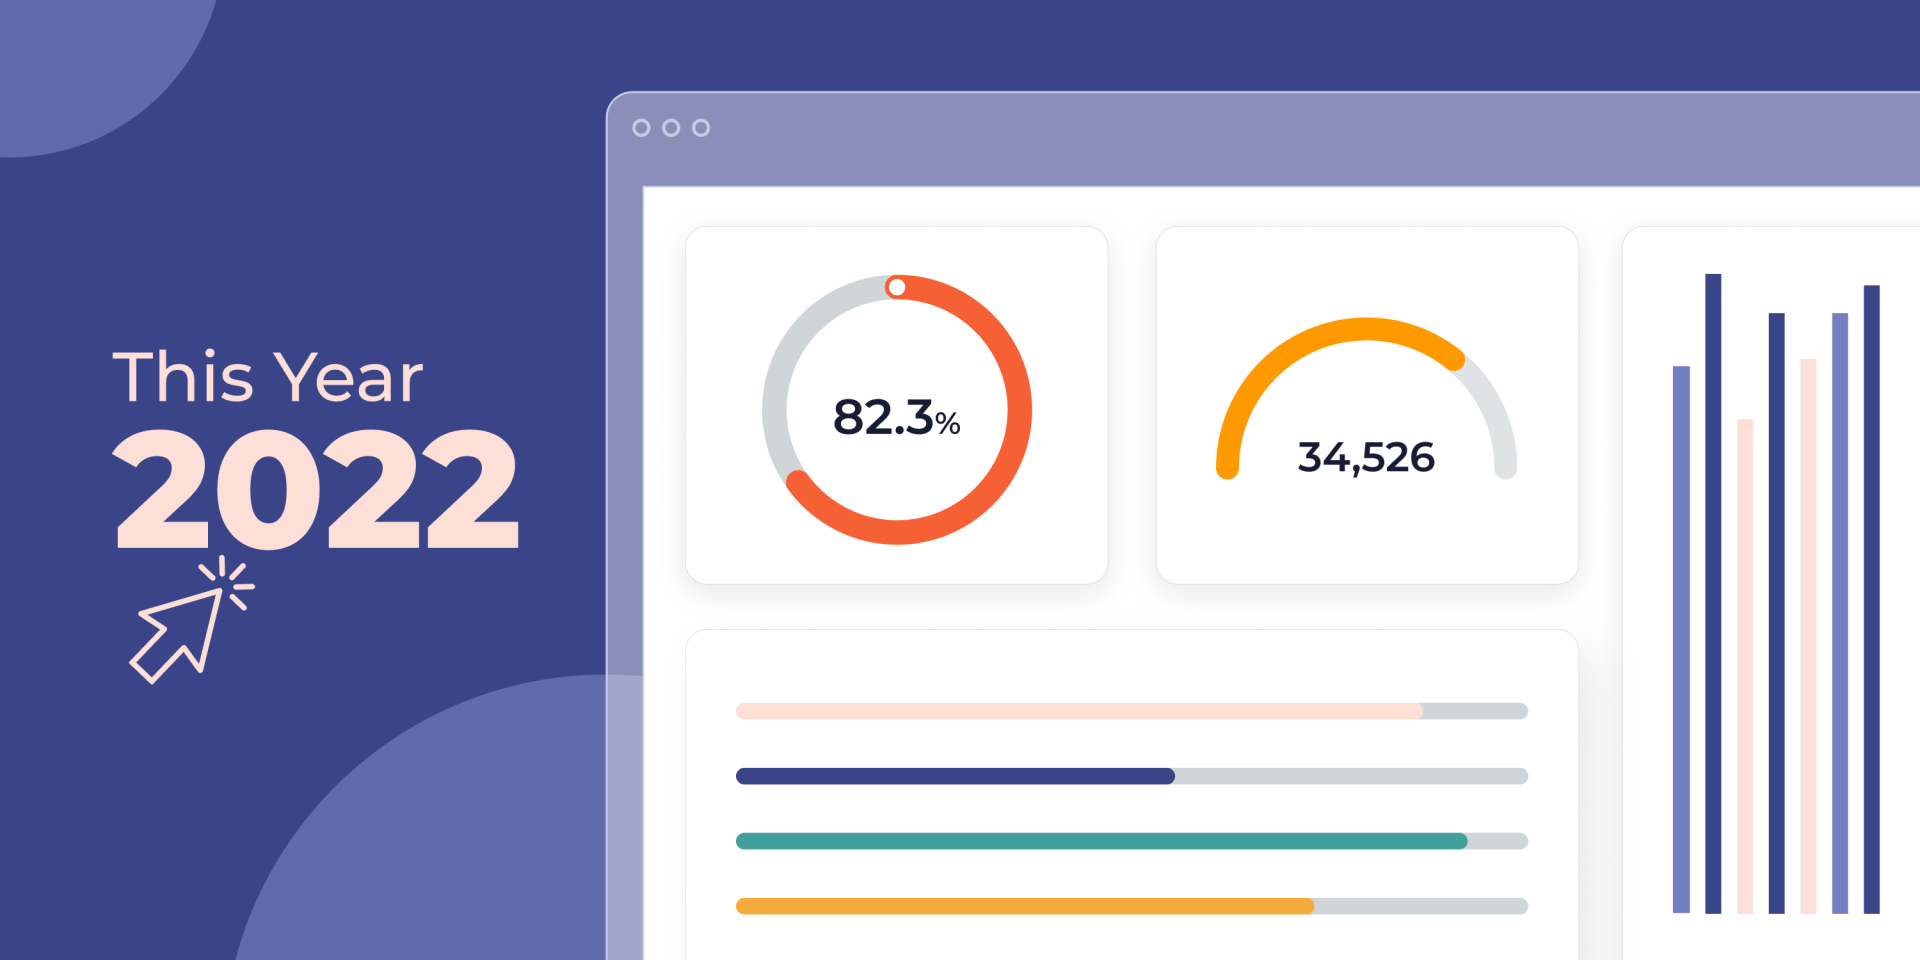
Metrics are numbers, percentages, and statistics that enable you to track progress and performance in achieving business goals. Here are the metrics that matter for SaaS companies.
1. Churn Rates
Your churn rate is the percentage loss of customers or revenue over a given period of time. SaaS businesses have high customer acquisition costs and it takes up to one year to recoup this cost per customer. Long-term customers play an important role in sustained growth, which is why churn rates are so important to monitor and keep low.
The customer churn rate measures the percentage of your subscriber base that canceled or didn’t renew their subscriptions in a specific time window. Revenue churn measures the loss of monthly recurring revenue (MRR) from churned customers and downgraded subscriptions. A useful way to gauge the likelihood of churn is through a
customer engagement score, which is a customized list of behaviors and inputs that indicate the stickiness of a customer with your platform.
Aim for a monthly churn under 1% and an average of roughly 5%. If you have 100 customers at the start of February and 94 customers at the end of the month, your churn rate is 6%. More formally, subtract the number of customers at the end of the period from the starting figure, divide the answer by the starting figure, and then multiply the result by 100.
If you notice a high churn rate, it’s important to think of ways you can provide extra value to subscribers so they’ll be less inclined to leave. An example is Duda’s
white label website building platform, which you can embed as part of your SaaS solution and help businesses establish their online presence.
2. Customer Retention Rate
Whereas customer churn measures the percentage of customers that sign up to your service and leave, the retention rate measures the percentage of customers that sign up and stay with you. Think of retention rate as on the other end of the spectrum from churn. You want to keep it high because, with consistently high retention, you’ll need to dedicate less investment in costly new customer acquisition strategies.
The average SaaS retention is 95% per year. Calculate by dividing the number of customers continuing to subscribe at the end of a period by the total number of customers at the start of that period, and multiply the result by 100 to get a percentage.
3. Conversion Rate
The conversion rate is the percentage of leads that become paying subscribers to your SaaS platform. The average conversion rate for SaaS businesses ranges from 3-5%.
There are different ways to calculate SaaS conversion rates depending on the actions you define as a conversion. One common method is to calculate the percentage of trials that become paid subscriptions.
There are many different strategies to try and increase conversions. Examples include A/B testing copy or pages, better targeting, maximizing customer value, and improving the onboarding process.
4. ARPU/ARPA (Average Revenue Per User/Account)
Average revenue per user (ARPU) is a monthly or yearly measure of the revenue generated per user. A related measure is average revenue per account (ARPA), but this figure may slightly differ from ARPU since a single user could have multiple accounts.
To calculate monthly ARPA, simply divide your total monthly recurring revenue (MRR) by the total number of accounts. Replace the number of accounts with the number of users if you want to measure monthly ARPU. There is no standard benchmark for ARPU because it’ll vary depending on the industry, pricing model, and location.
As a measure of the current value of an individual customer, ARPU indicates the effectiveness of product development, sales and marketing efforts. Furthermore, investors can use this metric to gauge whether a business seems worth investing in.
5. Monthly Recurring Revenue (MRR) / Annual Recurring Revenue (ARR)
Monthly recurring revenue (MRR) is a measure of the ongoing revenue you receive on a monthly basis from active (paid) subscriptions while the yearly equivalent is annual recurring revenue (ARR). To calculate MRR, multiply your ARPU metric by the number of subscribers in that month. A useful related metric is the MRR growth rate, which is the net increase or decrease in MRR from one month to the next.
The utility of MRR is that it serves as a good baseline measurement of how well you’re doing and how sustainable your business model is. Revenue and profits trickle slowly into SaaS businesses from subscriptions. Consistent and predictable revenue signifies the health and momentum of your business and helps you make more informed decisions about your future business strategies.
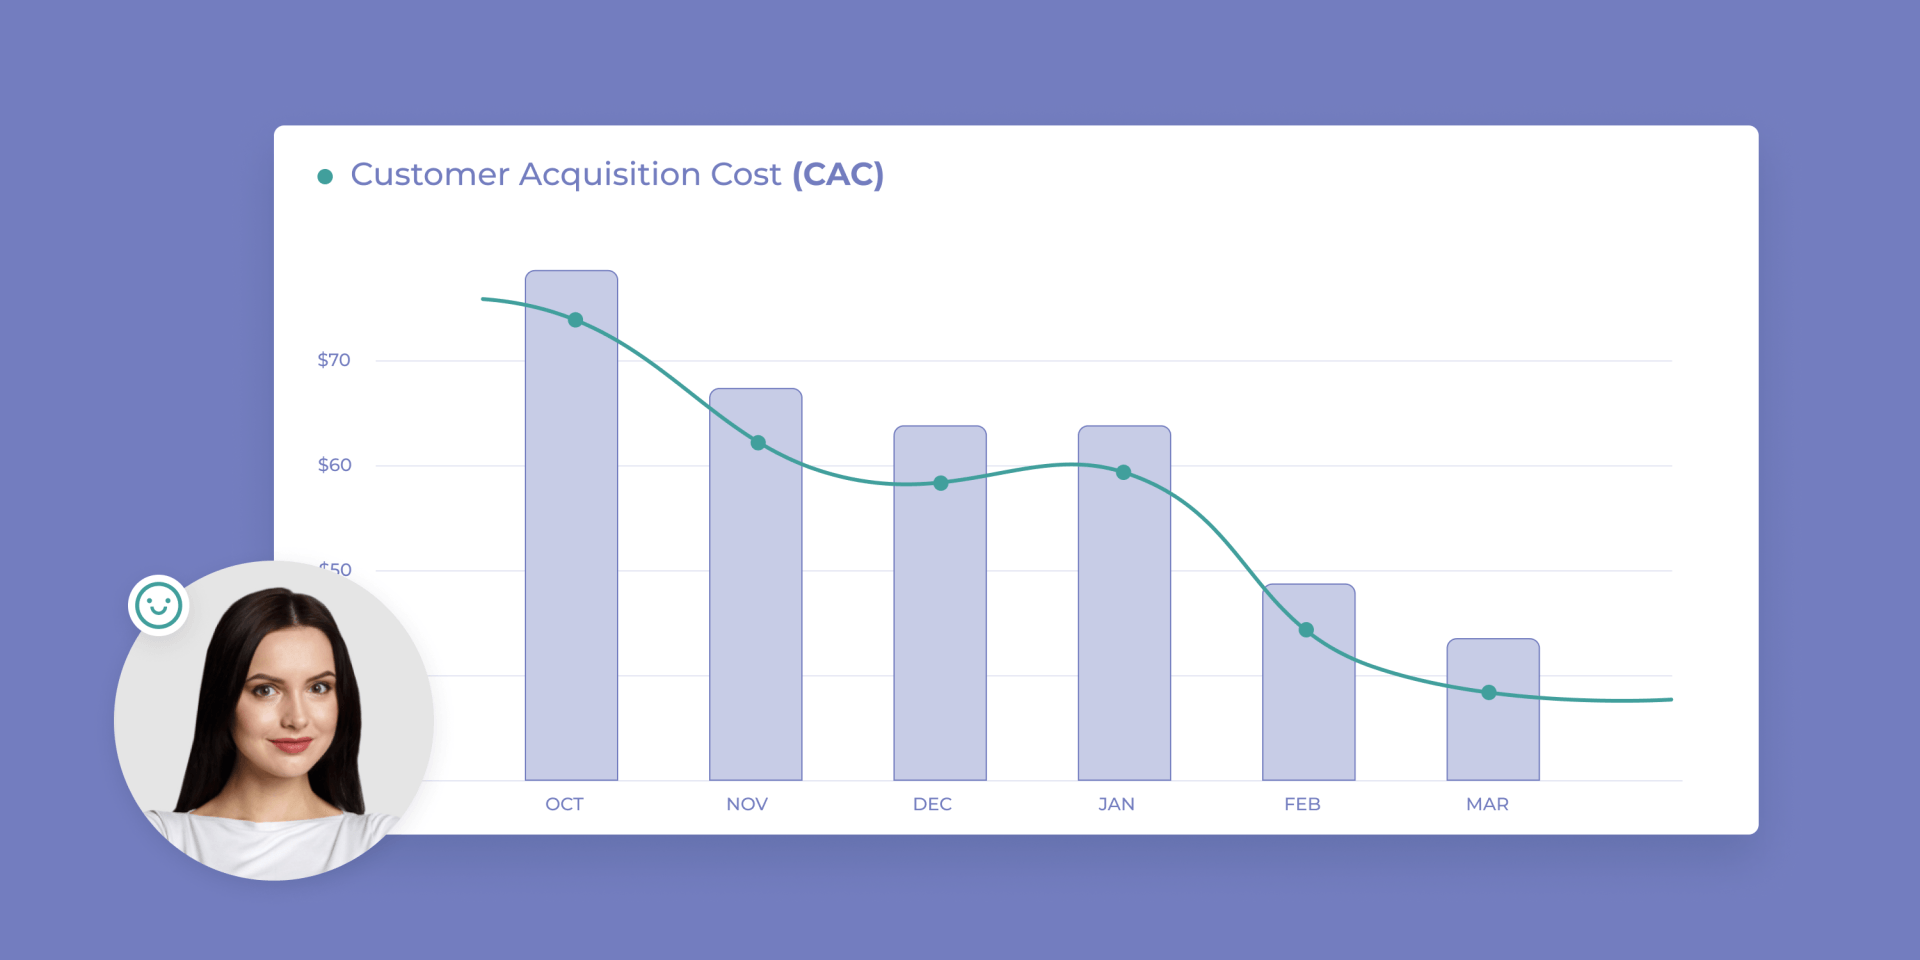
6. Customer Acquisition Cost (CAC)
Customer acquisition cost (CAC) is a precise measurement of how much it costs to acquire new customers. To calculate CAC in a given time window, add up all sales and marketing expenses and divide by the total number of new customers in that time period.
This is one of the most important SaaS metrics to analyze because the SaaS business model calls for understanding and optimizing how many months of revenue it takes before recovering the cost of acquisition. Tweaking your sales and marketing funnels is one way to help reduce CAC.
7. Customer Lifetime Value (CLV)/ LTV
Customer lifetime value is one of the most useful SaaS metrics for understanding how much your average customer is worth to your business. A high CLV indicates brand loyalty and the right product fit, both of which serve as useful proxies of future growth and business viability.
There are a number of ways to calculate this metric. One popular method is to multiply the average customer lifetime by the average revenue per account. To benchmark CLV, compare it with your CAC and aim for it to be at least three times the value of the cost of acquiring customers.
8. Active Users (DAU/WAU/MAU)
Broadly speaking, SaaS companies count active users as the total number of unique users logging into your app in a given timeframe. You can measure this metric daily, weekly, or monthly. You might consider customizing the metric to your specific platform by including other indications of user activity, such as creating a report or completing a task.
The value of measuring active users is that it indicates the perceived value of your product to users. To increase this metric, consider building an email marketing campaign that highlights different ways to use your platform or features customers might not know about.
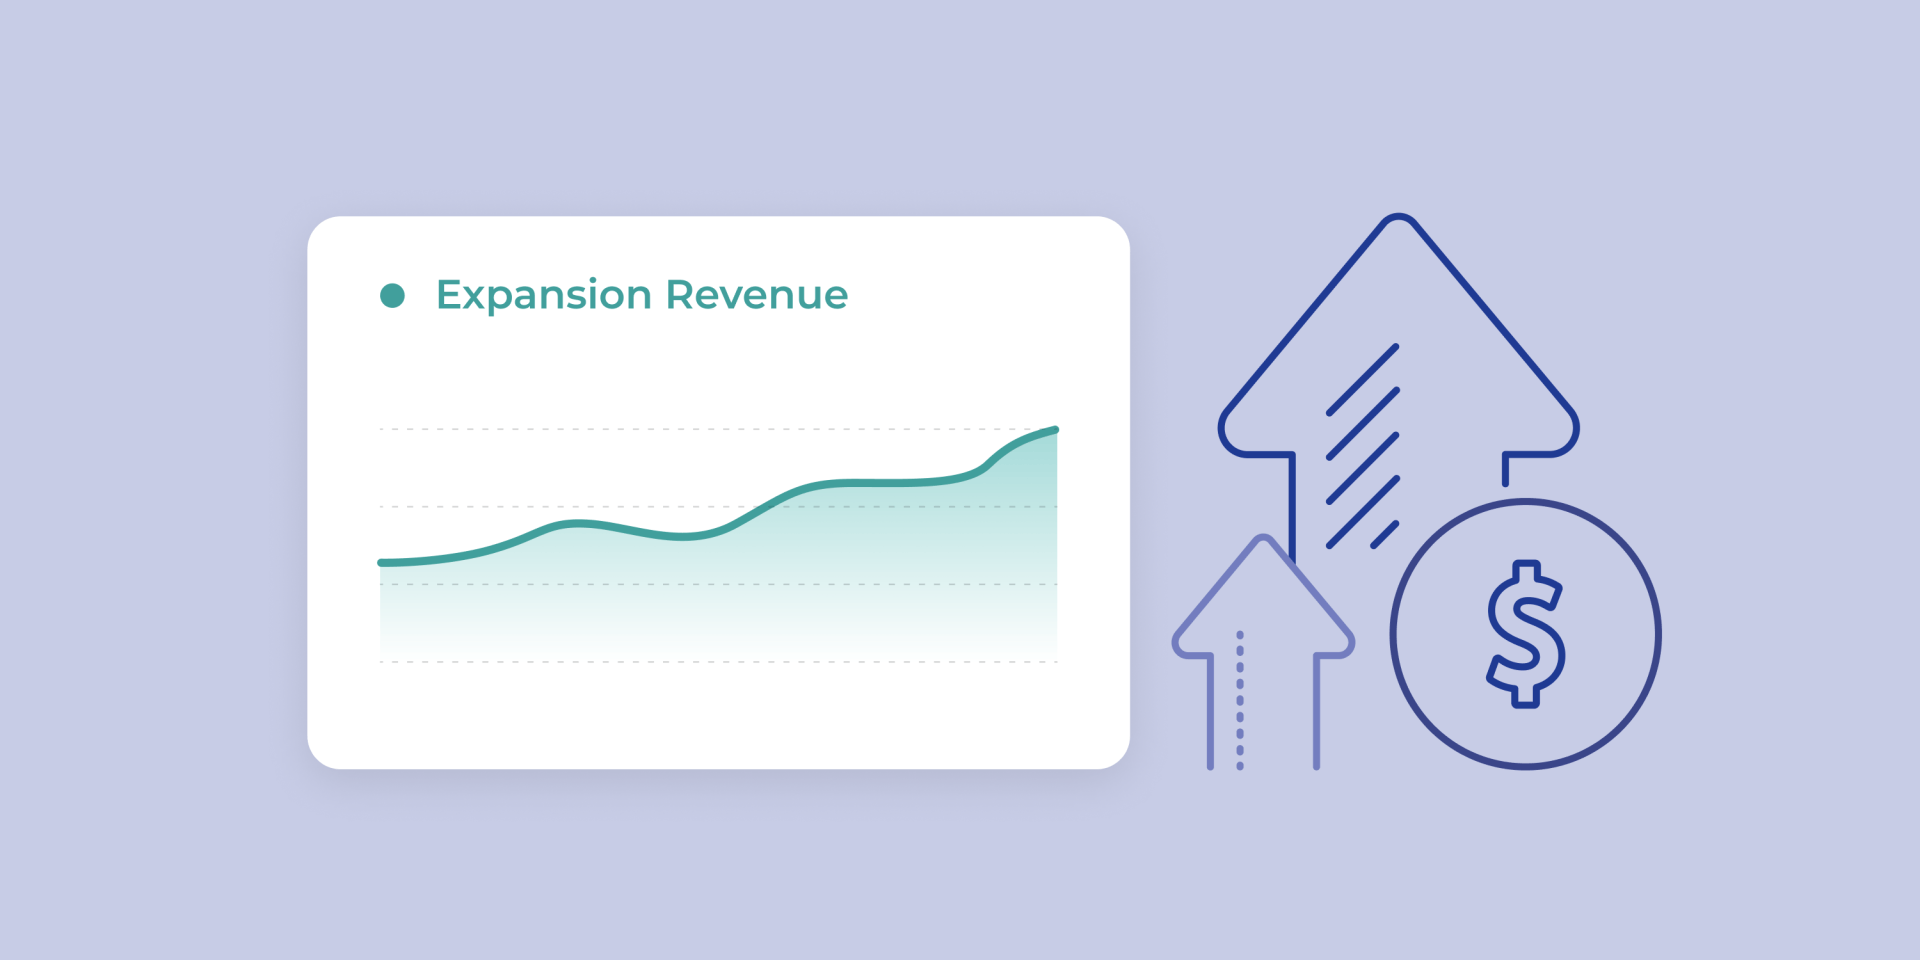
9. Expansion Revenue
Expansion revenue measures your company’s monthly recurring revenue from cross-sells and upsells to existing customers. This metric is an excellent indicator of growth because true SaaS growth comes from existing customers rather than new customers.
Generating expansion revenue comes from delivering extra value to subscribers, better understanding the customer journey, and making it easy to upgrade. There is no particular benchmark figure to aim for. The important thing is to measure this metric monthly so that you’re clear about whether you’re growing due to happy customers.
10. Net Promoter Score (NPS)
Net promoter score (NPS) provides a quick and easy way to measure customer experience and predict future business growth. This metric is a simple rank of the likelihood that customers would recommend your SaaS solution to other people. You can run NPS surveys with a single-question email or in-app survey.
The index used for NPS covers -100 to +100 with any positive value being a good indicator of a solid customer experience. Expect an NPS score of 28 if you want a high-level benchmark for what good looks like.
To get the most from NPS, combine it with user behavior SaaS metrics. Try to understand what makes people happy with your solution so that you can reduce churn and increase retention.
11. Activation Rate
Activation is the point in time at which a customer first achieves the core value of your SaaS platform. The activation rate depends on your definition of a specific user action that indicates activation. An example of activation is a trial user becoming a paid subscriber.
To calculate the rate, divide the number of users who completed that action by the total number of users of your service. Aim for an activation rate between 20-40% and you’ll be doing well at helping customers realize the value of what you offer.
12. Burn Rate
The burn rate is a measure of how quickly a startup SaaS company spends its funding, and it’s usually measured monthly. Gross burn rate is the total cost of just financing overheads in a given month while net burn is gross burn minus your monthly recurring revenue.
A tricky point about burn rate is that there is no standard or average benchmark to compare against. One
source says, “as a rule of thumb, your monthly burn rate should be less than 10 percent of your last funding raise or starting cash in the bank”. It’s important to manage and control your burn rate so that your SaaS business survives until it breaks even and eventually reaches profitability.
13. Conversion Rate
The conversion rate is the percentage of leads that become paying subscribers to your SaaS platform. The average conversion rate for SaaS businesses ranges from 3-5%.
There are different ways to calculate SaaS conversion rates depending on the actions you define as a conversion. One common method is to calculate the percentage of trials that become paid subscriptions.
There are many different strategies to try and increase conversions. Examples include A/B testing copy or pages, better targeting, maximizing customer value, and improving the onboarding process.
Partner with a Website building platform to improve crucial metrics
Measuring these SaaS metrics is a great first step towards understanding the current performance and future prospects of your SaaS business. But the work doesn’t end with mere measurement; you need to figure out how to improve these metrics if you want your business to thrive in an increasingly competitive landscape.
Keeping up with the competition calls for creativity. To reduce your churn rate, for example, think about how you can offer added-value elements in your service. Offering your customers easy and effortless online presence through partnering with a website building platform, like Duda, is creativity at its best.
Appfolio, for example, was able to reduce its churn rate by 4.8% by partnering with Duda to provide property managers with websites together with its property management software, allowing them to establish a much needed online presence for their businesses.
To learn more about how we can help you improve these metrics,
contact us.
Related Posts
By Ilana Brudo
•
July 21, 2026
Stop shipping decorative AI wrappers. Learn how to design natively embedded AI features that actually reduce customer workload and drive real SaaS business value.
By Shawn Davis
•
July 8, 2026
Discover how AI is shifting online search from traditional SEO to AI Engine Optimization (AEO). Learn key strategies for content volume and freshness to boost visibility.
By Shawn Davis
•
July 2, 2026
Learn how SaaS companies can evolve pricing strategies for the AI era, balancing outcome-based models and usage-based shifts to effectively capture value.
Show More