The same day the HTTP Archive introduced the
Core Web Vitals Technology Report, Duda shared its process for optimizing its overall platform for Core Web Vitals at the Google CMS Leadership Forum.
This was the first time we have publicly shared our closed-loop process for measuring, analyzing, and continuously improving the Core Web Vitals performance of Duda across our entire platform of over one million published websites.
Duda’s process moves through the following stages.
Measure
At the platform level, Duda collects Real User Monitoring (RUM) performance metrics — field data — across tens of thousands of websites that are deployed on the Duda platform. This real-world data is required to give us an accurate understanding of where we stand on various CWV metrics and what real issues exist.
In addition to these performance metrics, we also look at the traits of every website in the dataset. For example, for each site, has custom code been added? How do different pages of the website perform? What templates or themes are being used? What are the detailed technical traits of various aspects of the site (for example, is the Largest Contentful Paint driven from a paragraph of text, or an image, or a video, or some other HTML element)?
All of these aspects give us data that can help us in our ongoing analysis and improvement of Core Web Vitals across our entire platform, which benefits all of our customers.
Analyze
As we collect platform-wide Core Web Vitals data, we do something unique. In addition to the raw performance data, we merge and enrich it with other site information such as:
- Widget usage
- Geographic region
- Age of site
- 3rd party app installs
- And many more data points
We then slice and dice this enriched data to find commonalities in sites with troublesome LCP, CLS or FID scores.
Once we identify commonalities, we’ll use Google Dev Tools or Lighthouse to replicate the issue and form a hypothesis to test that will, hopefully, lead to system-wide improvements.
This analytical approach has uncovered a number of situations where design, implementation or other decisions substantially affected the user experience. A few examples:
- One large customer with 10,000s of sites in Europe had implemented a custom cookie banner that was frequently the largest element in the viewport, making it the element that was driving LCP, due to its size on mobile.
- One popular and heavily used 3rd party app caused significant Cumulative Layout Shift.
- Through our testing and analysis, we learned that CLS is also frequently caused by delayed loading of Google Fonts.
- And notably, large hero background images very frequently are the Largest Contentful Paint item and are a key driver to that metric.
As we confirm these research items, we are able to test and implement improvements that aid all our customers.
Improve
As we continue to iterate on this process, we regularly test and deploy improvements to the platform.
We closely monitor improvements and look at impact across all sites. We also look at recently published websites, as we have learned that changes can take some time to fully roll out to all sites across our platform. This helps us quickly validate that changes made are having an impact.
Finally, we also verify our findings and improvements on a monthly basis against Google’s CrUX (Chrome User Experience) data, to ensure our internal data, findings, and conclusions align directionally with Google’s published data.
Ongoing continuous improvement
Duda has always placed a high value on performance and user experience, and has invested significant research and development resources toward optimizing for Core Web Vitals over the past year.
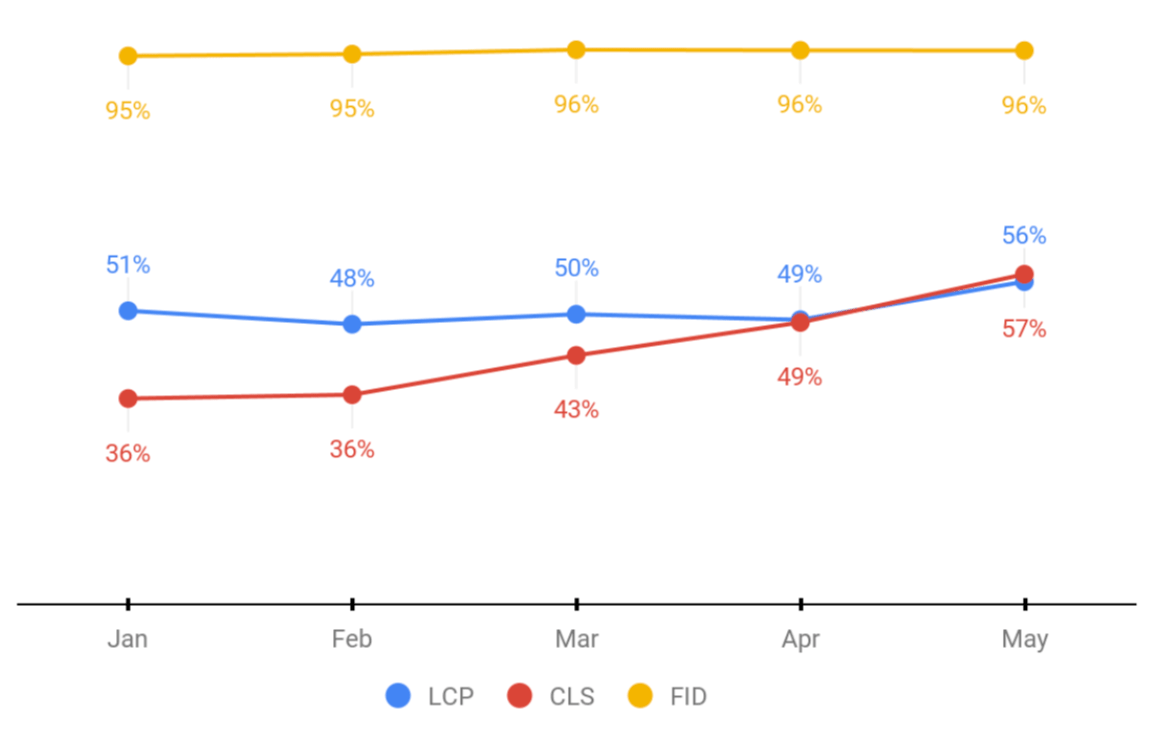
Our commitment to this process is showing results. For the first five months of 2021, we have seen a consistent improvement in Duda’s Core Web Vitals scores. While we have been tracking, analyzing, and acting on this information and research based on our own data for many months, we have learned today that our approach directionally aligns very well with the data that the HTTP Archive now makes available to everyone in the
Core Web Vitals Technology Report.
We thank Google for the opportunity to present our findings today as part of this forum, and look forward to engaging with them and the rest of the community to improve the user experience for the millions of individuals who collectively rely on our platforms in the months to come as Core Web Vitals metrics continue to roll out.