Pricing is all about
capturing value. This idea is a foundational element of James Wilton’s approach to pricing and packaging.
James is the Managing Partner and Founder of
Monevate, a monetization and pricing strategy consulting firm for growing tech companies. He has spent over a decade and 20,000 hours transforming pricing strategies at
SaaS companies—helping them maximize their customer ACV, NRR, and ARR growth.
This article is based on a presentation he gave during the “Vertical SaaS Roadmap to Revenue Expansion” online event. The complete recording is available today on YouTube.
His session explored the benefits of strategic pricing, particularly for those in the Vertical SaaS space. It’s a valuable area to focus on. Startups that transformed their pricing strategy have realized a 10-15% bump in their revenue growth rate.
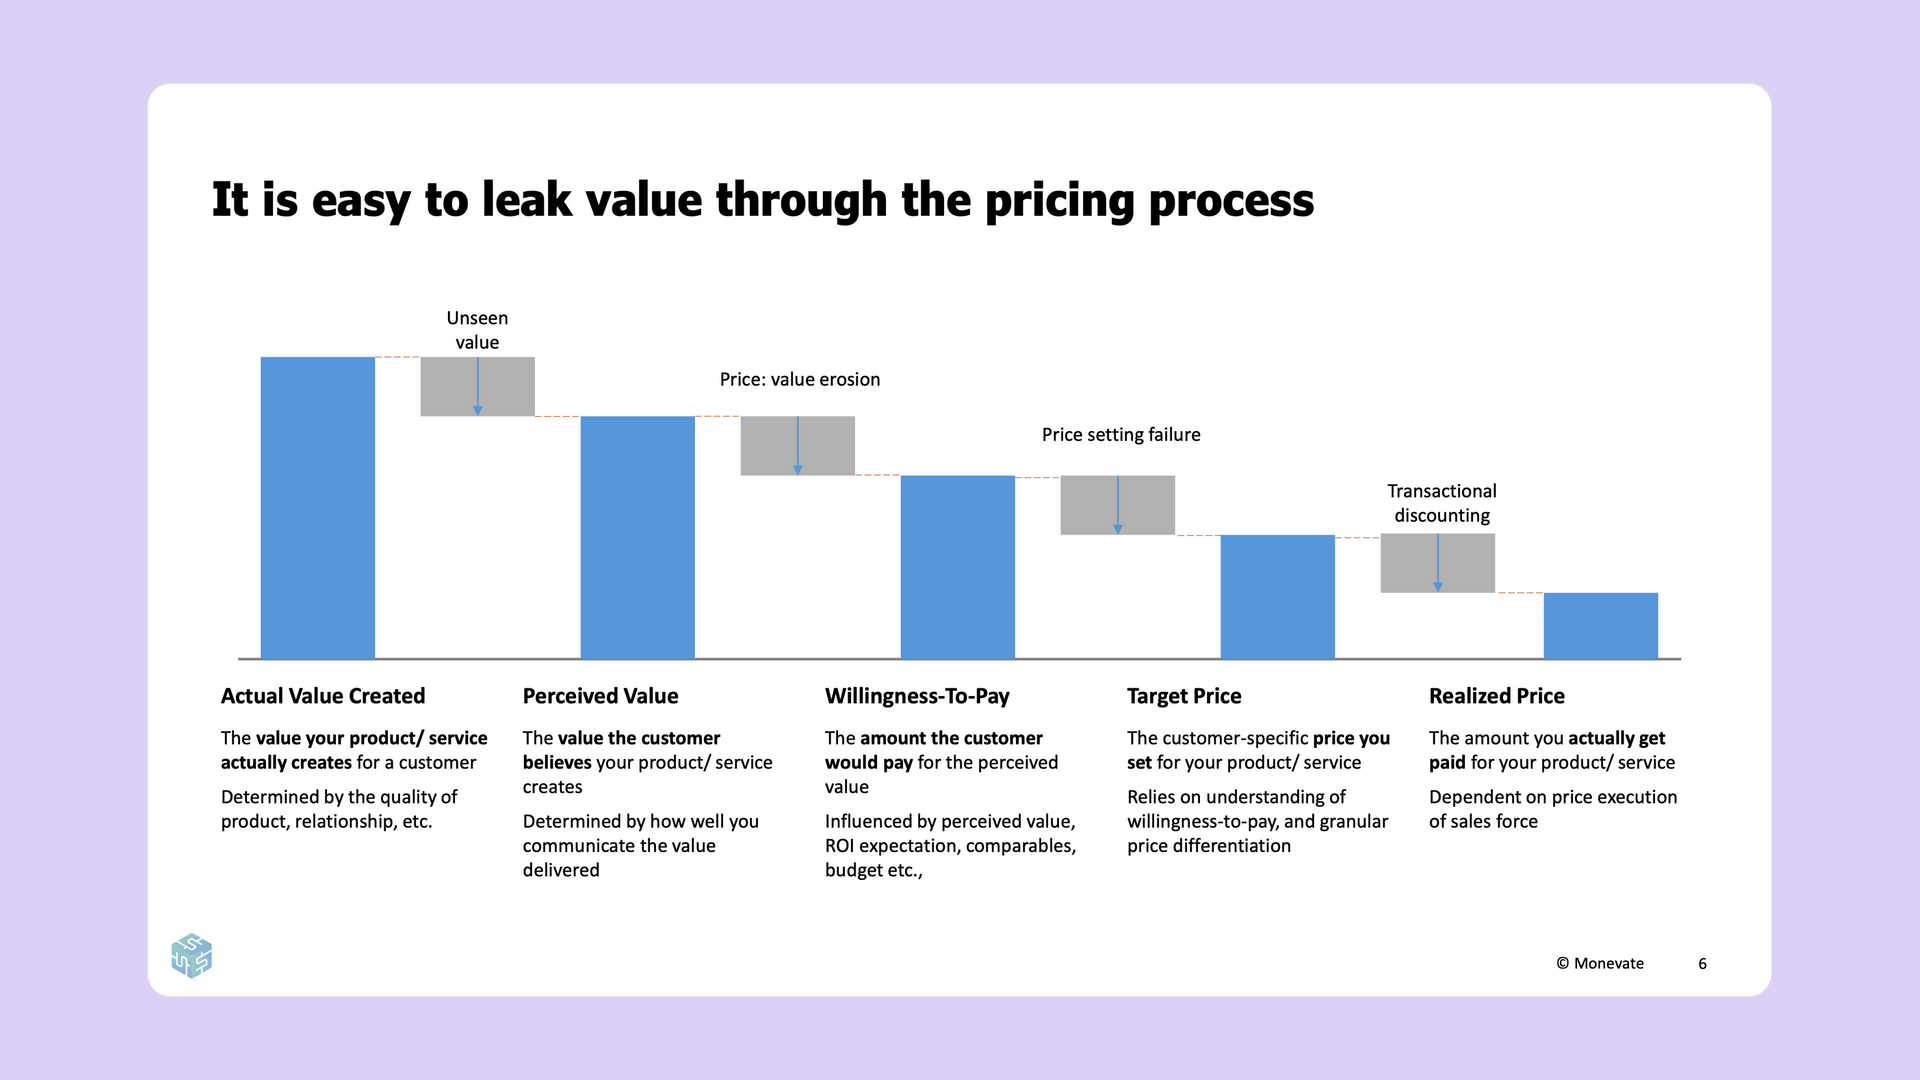
The value leak
Your vertical SaaS solution creates a ton of value for your customers. Your goal, when pricing your products, is to capture a fair portion of that value. Unfortunately, that often isn’t what happens. Instead, a significant portion of value is leaked between the creation of your solution and the actual purchase.
Every service you offer, for every particular customer who’s buying it, provides a certain amount of “actual” value. This value is often abstract at first, needing to be uncovered and presented. If you are unable to convey the full value of your service, then your customer may only truly see a portion of the value you’ve created. This smaller metric is called the “perceived” value.
There are dozens of reasons for the discrepancy between actual and perceived value, typically due to failures in messaging. You may be highlighting the wrong set of features or doing so in the wrong way. Regardless, a certain amount of value is being left unseen.
Value is further eroded by your customer’s “willingness to pay.” Customers consider many factors when deciding how much they’re actually willing to pay for a particular product or service. Return on investment, marketplace comparables, and various other elements all play a role.
Understanding how much your customers are willing to pay is essential when setting your service’s “target price.” This number is the true, bonafide cost that your service is being listed for.
It is wildly impractical to set your target price based on the willingness to pay of each and every individual customer. Instead, we often price based on segments. This practice forces us to determine, then undercut, the average willingness to pay of an entire swath of people—leading to some additional amount of value loss.
At the end of the day, the target price may not be the actual amount your customers pay. Sales incentives can reduce value even further via transactional discounts, leaving you with a final, “realized” price that is much lower than the initial value your product created.
After seeing where value leaks, you might be wondering—how can I capture more value?
Differentiation through packaging
Price differentiation may be the most important concept in pricing. This practice is essentially exactly as it sounds; you charge different prices to different customers. Doing so allows you to widen your TAM to include more price-sensitive customers while simultaneously charging more to less price-sensitive customers. When done well, this can have a huge impact on your revenue. Subscription Box, for example, added an incredible 30% in annual recurring revenue by offering a premium tier.
In order to differentiate your pricing, you’re going to need a “price structure.” This structure can come in one of two flavors: Packaging or Price Metrics. With packaging, customers self-select which level or tier of product they would like to buy. Price metrics, on the other hand, scale automatically based on quantity.
While there are many different flavors of packaging, the most ubiquitous in SaaS is the “Good, Better, Best” approach—and for good reason too. This is a straightforward and easy-to-understand price structure that provides customers with simple choices and a clear upsell path right out of the box.
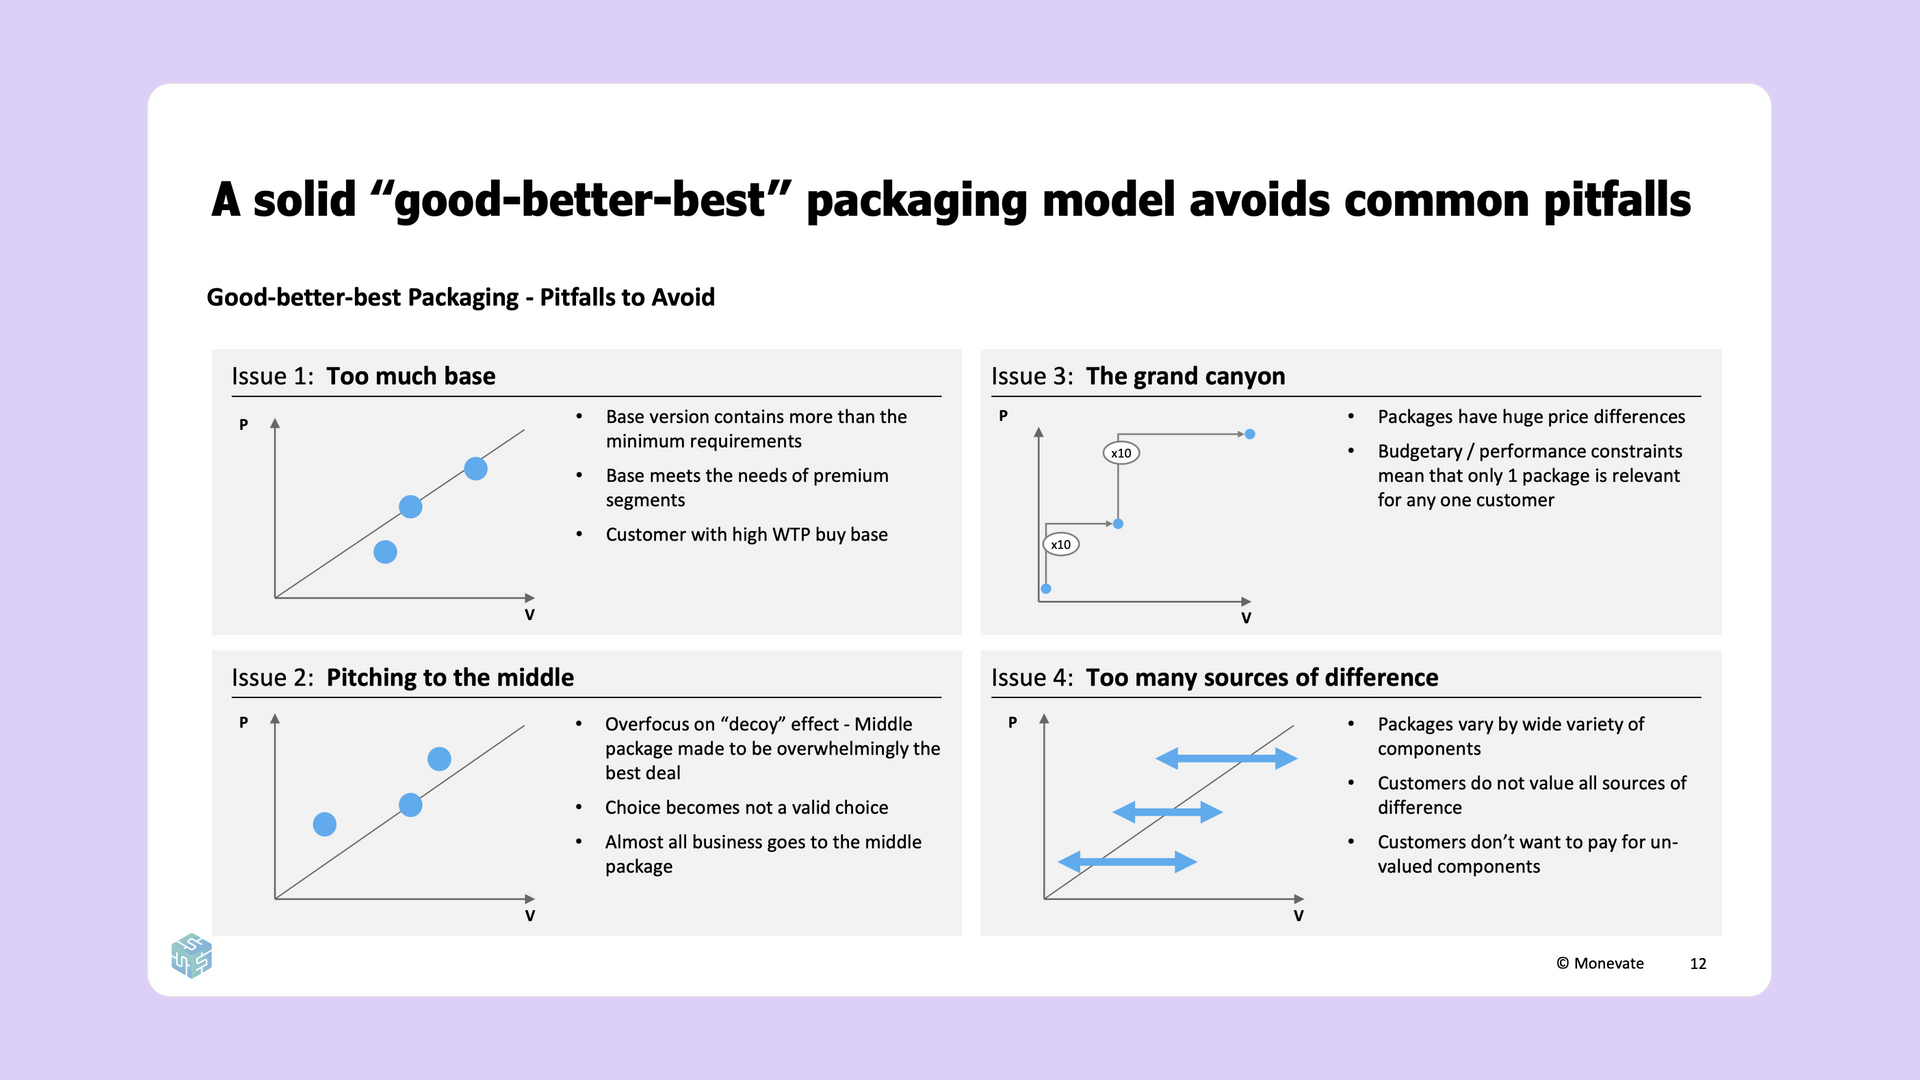
Keep in mind, this approach isn’t as simple as just creating three packages at random. There are four common pitfalls to avoid when developing a “Good, Better, Best” strategy.
- Too much base: In this scenario, your initial base offering is far more generous than it should be. It may include luxurious features that are unnecessary for a more minimally-viable experience. Instead, your base should focus on the smallest number of features necessary to extract value from your service.
- Pitching to the middle: Here, the middle package may overwhelmingly be the best deal. The base offering may be too impractical while the premium tier may include unnecessary features that don’t justify the upsell.
- The grand canyon: Substantial differences in price between tiers may lead to a “canyon” effect, where the leap between packages is too great for your customers to justify. Instead of a canyon, tiers should create more of a “ladder” effect. That means fewer differentiating features and a smaller price gap.
- Too many sources of difference: This scenario is similar to the grand canyon, except focusing primarily on features instead of price. Packages with a wide variety of different components can be difficult for customers to compare. Additionally, customers may not value all of the different components in a particular tier and typically won’t want to pay for components that they don’t value. The solution is to offer more niche features as additional add-ons, outside of the pricing structure.
Differentiation through price metrics
The flexibility of the SaaS industry allows for pricing based on virtually any metric, so long as it makes sense. This idea takes on many forms: “pay-per-seat,” “pay-per-view,” “pay as you go,” etc. The general idea is that pricing is tied to a particular metric, allowing for customer differentiation immediately without much segmentation.
Some popular price metrics across the SaaS industry are:
- User-based pricing:
This may be the most common price metric in SaaS today. Large companies like Zoom and DocuSign all charge based on the number of active users.
- Usage-based pricing: Another common price metric, this structure charges based on the number of times a certain feature is used. Examples include transactions, API calls, etc.
- Capacity-based pricing: More common in the infrastructure space, this structure charges based on the literal resources being used. As an example, cloud companies like AWS often charge per gigabyte.
- Business-based pricing:
This structure charges based on the size of the customer's business using metrics such as revenue, employees, or total customers.
- Outcome-based pricing:
A more novel approach, outcome-based pricing “shares the wealth” by charging a percentage of revenue generated or some other success metric.
Choosing the right metric to price against is key. You should ensure that, whatever you choose, is value-aligned, growth-aligned, acceptable, controllable, predictable, and, most importantly, auditable.
A metric that’s value-aligned will scale proportionately to the amount of value you’re providing your customers. This comes back to the very core idea of pricing—that you want to capture a fair amount of the value you create. Similarly, a growth-aligned metric will successfully scale alongside your organization.
An acceptable metric is one that is palatable to your customers. Your customers aren’t going to pay for some arbitrary metric that doesn’t feel fair. Similarly, it needs to be possible for your customer to actually control this metric themselves. A metric that’s fair and controllable, then, will likely also be predictable. That means the bill shouldn’t come as a total surprise to your customers at the end of the month—they should be able to generally predict how much you’re going to charge.
Finally, this metric absolutely must be auditable. If you can’t objectively measure a particular metric, then you certainly can’t charge for it.
The case for usage-based pricing is clear, but there are several downsides that companies don’t always anticipate.
On the up-side, usage-based pricing:
- Is increasingly familiar to customers.
- Is highly scalable.
- Tends to inherently grow over time.
- Covers costs (for cloud-hosted companies).
However, some of the pitfalls of usage-based pricing are that it’s:
- Not always value-aligned.
- Not predictable.
- Typically doesn’t count as ARR.
- Requires a high level of effort to implement.
Identifying the perfect price metric for your company isn’t easy, and implementing it even less so. Structuring your price metric in such a way that it is predictable, acceptable, and all of the other values listed above requires a thoughtful architecture tailored to your business.
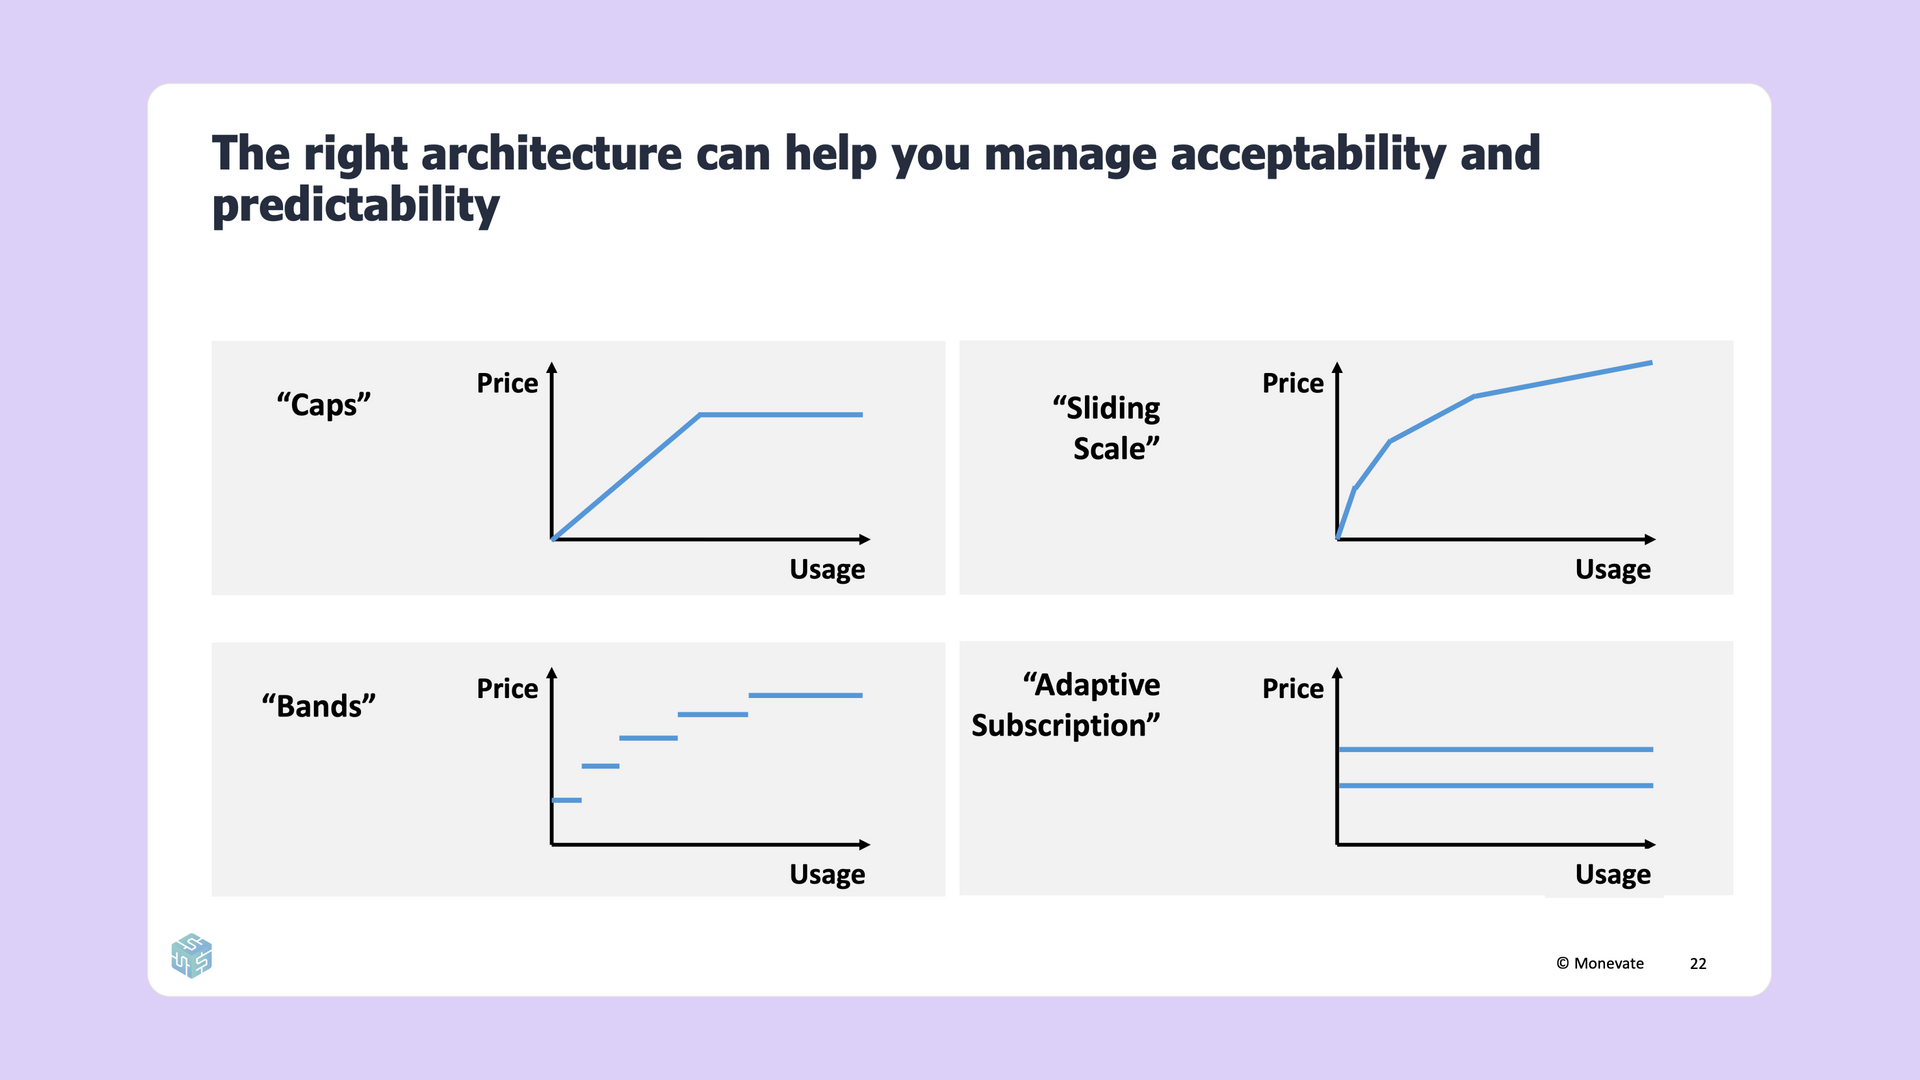
Consider your pricing metric as a graph, where the Y axis is “price,” and the X axis is “usage.” The way you define the relationship between these axes is your “architecture.” There are four common architectures used for pricing metrics:
- Caps: This architecture “caps” the price to a single, maximum amount. Any usage beyond this point is essentially free.
- Sliding Scale: As your client’s usage increases, the price decreases. This plays off of the “economies of scale” concept, rewarding increased engagement with discounts.
- Bands: Price bands charge a set amount for a certain ratio of usage. An example of this may be cloud storage, where you pay for a virtual drive up to 50GB, then upgrade to the next band when you need additional capacity.
- Adaptive subscription: With an adaptive subscription, your company charges a fixed amount for usage capacity rather than actual usage. If users exceed this pre-allocated capacity, they pay an upcharge. However, if capacity goes unused, they do not receive a discount. This is similar to how many mobile phone providers charge for data. Unlike other architectures, this method provides a means to upsell.
The final architecture, adaptive subscription, offers a great mid-point between packaging and price metrics that includes benefits from both options.
Are you undercharging?
While we all want to give our customers the best bang for their buck, the reality is you may be undercharging for the services you provide. How can you tell?
- Customers and prospects never complain about your prices or often talk about the “great value for money” that you provide.
- Your churn did not increase the last time you put through a price increase.
- Your win rate is very high.
- Your sales reps rarely ask for higher discounts.
- Your weaker competitors charge the same as you, and/or your comparable competitors charge higher prices than you.
If you do find that your prices are too low, the obvious next step would be to understand what those prices should be. There are several analytical approaches to estimate your customer’s willingness-to-pay that you can use to arrive at a suitable price level.
One example is the
Van Westendorp technique, which is good for companies looking for a rough range of how different customers would expect to pay for a new product. A different technique, the Value Proposition Map, is better suited for companies operating in a highly competitive market with highly visible customers. Unlike the Van Westendorp technique, which can help you determine a viable price range for each customer, the Value Proposition Map helps determine the price premium you can command versus your competition.
Preventing unwanted sales discounts
Entrepreneurship in your sales team should be applauded, but salespeople, when compensated by a flat percentage of revenue, have an incentive to discount as much as possible. This is often the cause of the final value leak, the gap between your target price and realized value.
Salespeople are looking to maximize their expected payout. This value is a product of the relationship between the incentive payout if the deal is won and the perceived chance of actually winning the deal. This incentivizes discounting as the chances of winning drop significantly as the price increases.
There are levers you can pull to stop value leakage through unnecessary discounting.
- Rules:
Do not allow reps to price deals with unacceptable levels of discounting.
- Incentives:
Give reps “skin in the game” to push for lower discount deals.
- Enablers: Make reps feel better able to win at lower discount levels.
Putting it all together
When evaluating your own pricing strategy, there are a few key takeaways to consider. First, you want to build an effective price structure. If going the “good, better, best” route, avoid common pitfalls and evaluate your features to build the right tiers. If using usage-based pricing, use architecture to solve for value-alignment and predictability issues. You should also choose the right value-based price metric.
You’ll also want to determine your customer’s willingness-to-pay as accurately as possible using techniques like the Value Proposition Map. Reducing excessive discounts in sales is another great way to ensure you get the prices you deserve.
For a more detailed and in-depth look at these concepts, tune into James Wilton’s entire presentation available today
on YouTube.