How many times have you heard the following?
- "Test your software!"
- "Have you written tests?"
- "What e2e coverage do we have?"
- "Can we write an e2e test here?"
- "I'm waiting for e2e to finish the run."
- "Aw, dude, e2e is screaming again"
If you are a developer or part of any R&D team, these are probably some of the most common things you hear daily at work. And there is a reason why — testing, and especially end-to-end (e2e) testing, is critical. There are many reasons why testing is essential, but the two most common are:
- Your team's productivity — you want to be able to move fast, obtain good reliable feedback, and be sure you are not introducing any regressions in the development process.
- The value you provide to customers. As a business, your top priority is to make your customers happy, allow them to enjoy a quality product, spread the word and grow.
Testing gets even more critical if you are a fast-moving company working in an agile process to deliver software daily. Delivering software at this pace is a huge challenge because there is no time for manual regression testing at all, which means it needs to be automatic and on each pull request of every developer. Ideally, your developers will have fast and reliable regression feedback as soon as they commit their code. That way, if there is a new bug or regression, they'll have enough time to solve it or revert.
In this post, we will discuss what it means to implement a fast, reliable, and scalable e2e testing infrastructure. We’ll start by exploring the e2e testing world in general, what an e2e test is, and why it is important. We’ll also briefly discuss the main drawbacks of an e2e testing strategy and how it can negatively affect your development process. And finally, we will introduce our solution and explain how we reached a point where we are running thousands of e2e scenarios in five minutes.
Examining E2E Testing Strategy
In this section of the post, we'll examine what e2e tests are, why you should care about them, and issues that can arise.
What Is an E2E Test?
Simply put, an e2e (end-to-end) test is designed to test software from start to finish as a user would use it. For instance, let’s say you want to interact with a web application. Most likely, this would entail navigating to a specific URL of the application, filling out various forms, clicking on buttons, navigating through other pages and windows, and generally using the product in the way it was intended. Put another way, an e2e test is a user simulation (a bot, if you will) that tests your work by using it as a real human user would in real-time.
The difference between e2e tests and other testing strategies (e.g. integration tests, unit tests, component tests, etc.) is e2e tests the entire system as a whole. This means it should test the client-side, server-side, integration between the client and server, and the database as a complete system without any separations. The test should not make any assumptions about the system being tested. An e2e test should treat the product as a black box without knowing any of the product's internals.
Why You Should Use an E2E Strategy
As mentioned above, there are many strategies for testing your software - unit, integration, component, and e2e. The first three strategies are used to test particular parts of the system in specific conditions. In contrast to the unit and component testing, e2e tests are used to test the entire system as one, with all of its components and configurations. For instance, you can use unit or component testing to separately test things like writing data to a database, a specific function or two used by your REST endpoint, and your UI form. However, to test the entire process that starts with UI and goes all the way down to the database, you should use an e2e test, which will run in an environment as similar to production as possible.
The Problem With E2E Tests
e2e tests are critical to your team's productivity and the success of your company. However, they are not perfect, and there are obstacles to overcome to make them usable.
The first problem (and most common) is the flakiness of e2e tests. Natively, e2e tests are more prolonged, contain many complicated steps and operations, and spread across many components, pages and windows. Therefore, by definition, they have a higher probability of being unstable. The most common subproblems here are timings and scheduling of operations resulting in the web's asynchronous nature. We can solve these problems with smart event listeners, intelligent and conditional waits, retries, and self-healing mechanisms.
The second most widespread problem, which is directly related to our main topic of continuous integration and development and fast feedback to developers, is the execution time of an e2e test. You’ll recall from earlier in this post that unit and component tests are concrete and local, and this makes them very fast. Because unit tests don’t rely on any dependencies and using techniques like mocking, it is possible to run hundreds of tests in seconds concurrently. At Duda, we run thousands of unit tests in parallel. On the other hand, e2e tests are more complicated, cover more parts, and have more steps - resulting in tests which can take 2-5 mins each. Running 100 e2e test cases in sequential order can take 3-8 hours!
A situation in which feedback only comes after three hours is not acceptable. It also can be pretty dangerous. During these three hours, there could be dozens of additional commits. Even worse, the new commits can use the bad commit, making it even more dangerous as it will be much harder to track the problem down.
Another good point to think about is the scale. What happens to scale? What happens if we add a new feature which requires an additional 50 tests? Or 150 tests? What happens if we have a total of 500 e2e tests in an extensive system?
OUR SOLUTION
As we mentioned before, Duda runs thousands of e2e tests, with super high coverage, on each pull request to our main branch within just five to seven minutes. So how did we get here?
1) It All Starts With Good Test Structure
Everything begins with writing good tests. There are a lot of discussions on the web about what to test, how to test, how to write a maintainable test automation framework, pyramid or trophy strategy, etc. These discussions are essential and have their place. Still, our discussion here is not about these topics. We are focused on running tests in the most performant way possible to get excellent and reliable feedback as quickly as we can.
Let’s start the discussion with the e2e test structure we use at Duda and how it helps us run thousands of tests in minutes.
The Basics
We are using Selenium and WebDriver to run and automate browsers. We also use the Java programming language to write code, and we use TestNG to run tests. Each e2e scenario should be implemented inside a
Java Test Class, which eventually would run in a unique environment by TestNG.
Atomicity of E2E Scenarios
Each e2e test should be atomic, which means that it tests a single and well-defined user e2e operation. One good example of just such an operation is the login process which users go through when they sign into our platform. Another good example is clicking on a trash icon to delete an email from a Gmail inbox.
The atomicity of tests is crucial because of the following reasons:
- You only want to test what you need to and nothing more. This makes it effortless to instantly track down the problem in the case of drawbacks or regressions.
- Having an atomic e2e test is good for the test's runtime.This is true because atomic e2e tests only perform what they should, nothing more; hence, no overhead, no unnecessary costly operations, and no wasting time.
- If your tests are atomic, then it is easier to maintain them. We can easily remove, add, fix, adjust and debug them in much easier ways. Atomicity is crucial for test independence. It enables you to run your tests in any order you wish without maintaining the execution order. Running your tests in any order increases your testing process's reliability, making sure each operation is done correctly without being dependent on other operations.
The Structure Has It All
Each Java e2e class will have a topic and contain up to five e2e atomic scenarios. These five scenarios will test spatially similar things; however, they'll be independent of each other. They won't use any assumptions about each other and they won't use any internal environment condition created during the scenario.
Moreover, each Java e2e class will start with a setup operation, which will construct the fundamental and most common environment for the five atomic scenarios that are about to run. The reason to have a setup operation is fairly straightforward — you don't want to have each test case building its necessary environment over and over again because it is time consuming. All you want is to have a common baseline so that your tests can concentrate on a specific task without carrying for the environment at all.
Finally, each Java test class will be independent and won't make any assumptions about other tests. It won't use any environment setup and/or configurations created by other tests. It also won't know the e2e scenarios of other tests.
The Meantime Results
So what do we have here? We have a fascinating structure — an independent Java e2e test classes containing independent atomic e2e scenarios. The atomicity of e2e scenarios and the setup function allows
each class to run in under two minutes
independently of each other. Having separate Java e2e classes, where each has its setup function, enables us to run test classes in a parallel and distributed manner.
For example, assume that we have 500 e2e scenarios. We can divide them into 100
Java test classes and run those classes in parallel on different computers. Because of the atomicity and the structure described above, each class executes in under two minutes,
meaning that we can run the entire suite in under two minutes. Let’s scale it up.
2) The Scalable Infrastructure
The structure described above enables us to run many test classes (and eventually test scenarios) in an independent, parallel and distributed manner. Theoretically speaking we could have a room full of 100 computers, where each computer would have Java, Selenium, web browsers and a specific test class installed on it. And, upon a specific trigger, let’s say a code commit, we could run these computers in parallel, each running a specific test class and all of them done in under two minutes of execution.
Fortunately, we don't actually need 100 physical computers. Instead, we can use a serverless computing platform to run them all.
Running Test Classes on AWS Lambda
AWS Lambda is a serverless platform provided by Amazon as part of AWS. Its purpose is to build smaller, on-demand applications that are responsive to events. Each AWS Lambda instance is equivalent to a remote computer with capabilities of under 3GB RAM and 512MB external storage. It runs a distribution of Linux supported by Amazon. Those computers are intended for small, short, and not intensive computing operations. And our idea is to run a single Java test class within a single instance of an AWS Lambda.
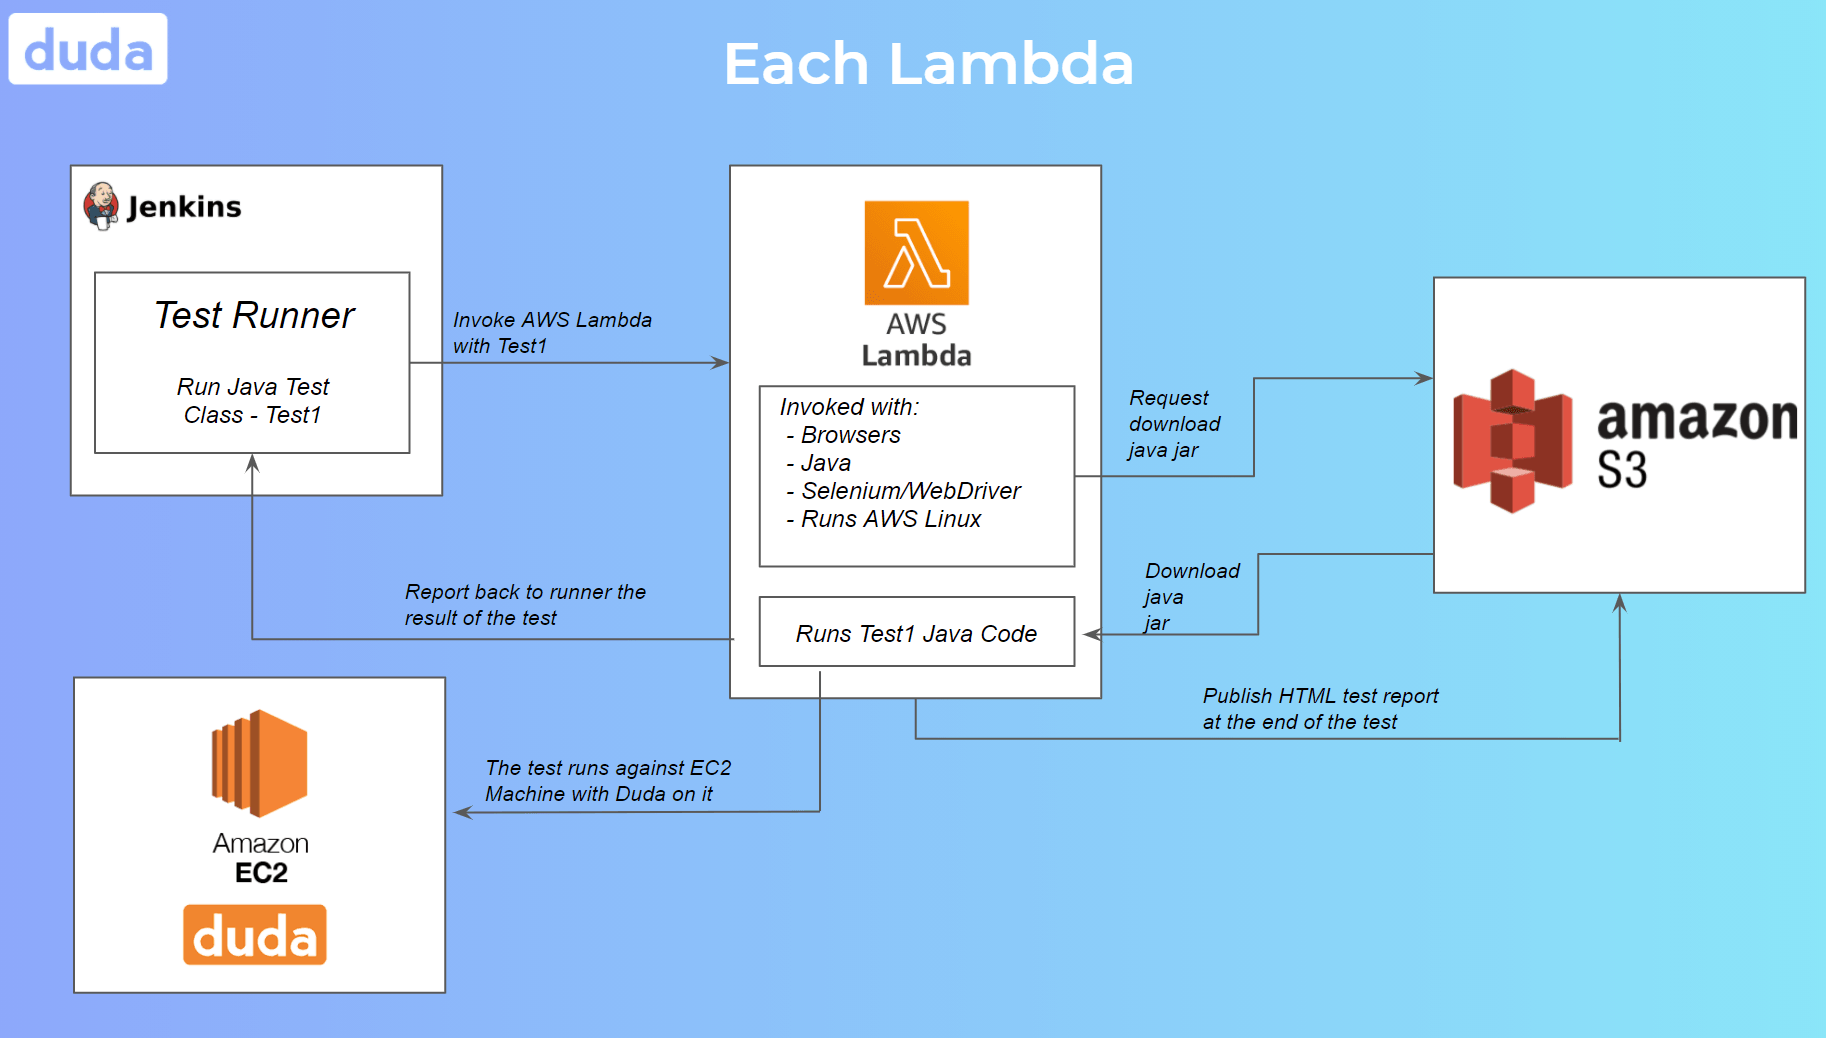
So, how does it work? On top of TestNG, we implemented a test scheduler mechanism; we will call it the “runner.” The runner gets the list of all
Java test classes as input and their paths inside the Java jar. It then uses a queue-like algorithm to execute a predefined amount of tests in parallel. For simplicity’s sake, let’s denote the predefined number of tests as X. For each test class that should run, the runner invokes an AWS Lambda, the Lambda instance downloads the jar from S3, and then runs the Java code that executes the test itself. When it’s done, the AWS Lambda goes down, returning its result to the runner, which will decide whether to retry the run or stop here and report a failure or success. At the end of the test class's execution, it makes room for the next test class in the queue to run, and the runner will schedule the next one. Thus, every single moment we are running X test classes in parallel.
Each AWS Lambda already comes with a JVM, the web browsers, Selenium, WebDriver, and the necessary tools and infrastructure for running the tests. These settings are general and invariant to the test classes themselves. Each instance gets spawned in a few milliseconds, the download of the jar takes another few milliseconds, and the test itself runs in under two minutes, which means each Lambda instance is up and running for approximately two minutes.
We’re Not Done Yet!
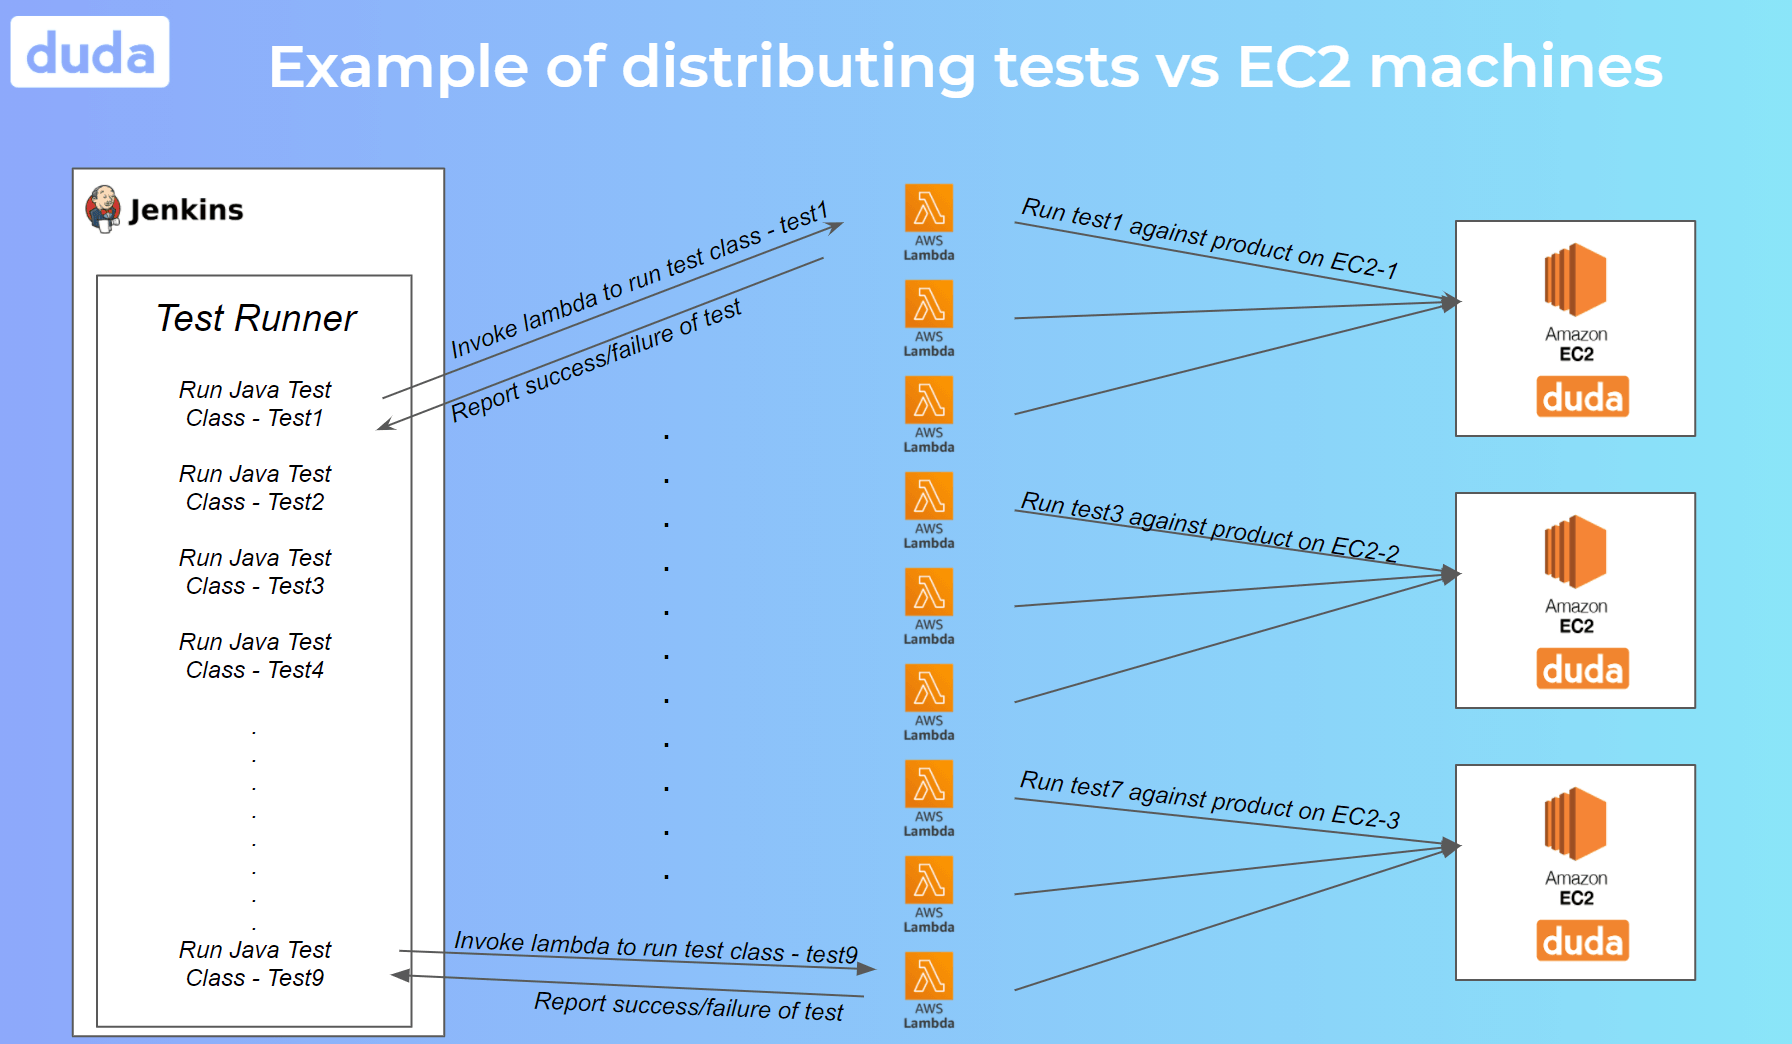
So far, we solved the scale problem of running multiple e2e tests in parallel. But now we need to deal with the bottleneck issue that this caused on the server. We couldn’t run 500 e2e scenarios against one test server; this would cause an overload of the system leading to prolonged test runs and even false failures. To overcome this problem, we need a mechanism that increases the number of tests running in parallel that doesn’t overload the test servers simultaneously.
We found a solution in an Amazon EC2 service. The Amazon EC2 is a cloud computing platform provided as part of AWS and used as a virtual machine to run applications. Each EC2 machine will have the same configuration — our back-end and databases used by the product. In other words, each EC2 machine is a single instance of our product.
Now that we can deploy any number of EC2 machines with our product in the air, we can execute X parallel tests against
each machine. Therefore, having deployed Y EC2 machines and running X parallel tests against each machine, we can run X * Y parallel tests. Consider our example above of running 500 e2e tests in parallel against one machine. We can now deploy five machines and run 100 tests against each machine, making our performance stable.
Finding and tuning the correct numbers X ( tests per server) and Y ( test servers) is a matter of experience and many experiments. It depends on your test performance and stability and the performance of your actual system and product. Performant systems allow us to run low amounts of test servers and run more tests against each server. On the other hand, having stable, fast, atomic tests also allows us to run many tests against each machine.
Conclusion
The infrastructure above enables our team at Duda to run many high-quality e2e tests in a parallel and distributed manner, having each pull request tested for a regression. This way we can provide our developers with the confidence they need, better manage our QA resources to focus on new features instead of regressions, and promise our customers a quality product. It also enables us to move fast. Since this is integrated into our main CI/CD, we can provide quick feedback to developers, and developers can quickly react to their code changes and prepare the software for a release.
Moreover, let’s see what the costs of adding another test to your pipeline are? In this use case, all you need to do is write a quality test, optimize it, stabilize it, and put it into the test runner. That’s it! From here on, it will be handled by the infrastructure. The costs are also proportional to the runtime of your tests on Lambda. Thus, having atomic and exact tests, reduces your costs. The same goes for changing, adjusting, and removing tests.
Everything is scalable, flexible, and maintainable.