MRR y ARR: Qué Son Cómo Calcularlos y 3 Estrategias para Aumentarlos

July 21, 2021
0 minute read

Una de las métricas clave, que debería ser revisada por cualquier empresa, pero que es aún más importante para el segmento SaaS (Software as Service) es el MRR. Las siglas vienen de Monthly Recurring Revenue y pueden traducirse como "ingresos recurrentes mensuales". 


De forma sencilla, se puede decir que el
MRR es un cálculo que se realiza con base en el valor pago por la suscripción.


El MRR se confunde a menudo con el ARR, que significa "Annual Recurring Revenue". Este término puede traducirse como "
ingresos recurrentes anuales". 


Si quieres profundizar tus conocimientos sobre estas métricas, ¡ahora es el momento! Todo lo que necesitas en este artículo.

¿QUÉ ES EL MRR (MONTHLY RECURRING REVENUE)?

El MRR es la métrica de los ingresos recurrentes mensuales y suele utilizarse para obtener una previsión mensual de las ganancias de empresas que trabajan con suscripción.


Aunque este tipo de negocio está comúnmente ligado a la prestación de servicios, como es el caso de los streamings, también hay muchas empresas que trabajan con productos en el modelo de suscripción.


Es lo que ocurre, por ejemplo, en los negocios que venden combos o incluso quien entrega semanalmente los kits de frutas y verduras a domicilio. 


En cualquier caso,
el MRR hace un seguimiento de los ingresos mensuales y colabora para hacer una previsión de cuántos nuevos suscritos surgirán. También identifica el número de cancelaciones que la empresa suele recibir cada mes.


Con estos datos, es posible hacer una previsión no solo de las ganancias, sino también de la necesidad de stock o inventario. 


Todo esto, sin contar que el gerente que tiene acceso a un MRR bien calculado también puede
analizar el crecimiento de la empresa, así como identificar las mejoras que se pueden realizar para minimizar las cancelaciones y ganar más clientes

¿POR QUÉ ES IMPORTANTE EL MRR PARA LA EMPRESA?

El MRR puede reunir las áreas financieras y estratégicas, ayudando siempre a evaluar el potencial de crecimiento de la institución. En la gestión de las empresas SaaS, el seguimiento del MRR es prácticamente esencial.


Al fin y al cabo, es esta métrica la que le permitirá al gerente tener una visión general del negocio y definir las
posibilidades en ganancias para el año siguiente. 


Como este tipo de empresa trabaja con suscripciones,
la única forma de evaluar el crecimiento del último semestre es calculando el MRR. Una vez calculado correctamente, esta métrica ofrece ventajas como:


  • Comprender la
    estacionalidad del negocio y estar preparado para los periodos en los que suele haber caídas en el número de suscritos;
  • Previsión de ingresos para los próximos meses o años;
  • Identificar cuál es el paquete que más fideliza clientes, es decir, en qué tipo de suscripción la persona permanece más tiempo;
  • Tener seguridad al saber el valor mínimo que se recibirá, en función de los clientes con suscripciones y contratos activos;
  • Los datos también pueden ayudar a fundamentar las estrategias para atraer y fidelizar clientes;
  • Mejorar la toma de decisiones, ya que es posible definir el valor mínimo que se facturará en los próximos meses.


CÓMO CALCULAR EL MRR

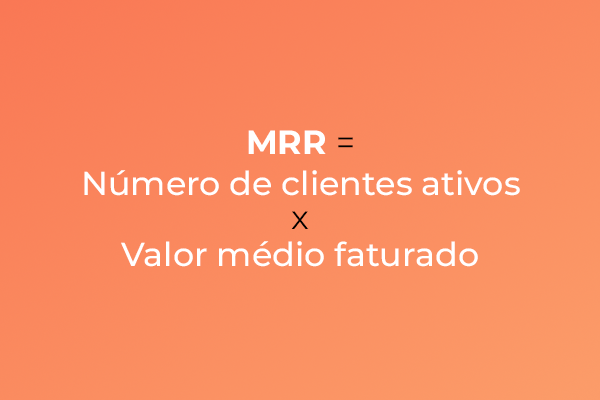
El cálculo del MRR consiste en multiplicar el número de clientes por el valor de la mensualidad.


Sin embargo, es importante tener cuidado cuando la empresa tiene más de un plan de suscripción. En este caso, el MRR debe calcularse primero
según el valor de la suscripción y luego sumarse

Imagina que tu empresa solo tiene un tipo de suscripción, que cuesta USD$30 al mes. Actualmente, cuentas con 1000 clientes. Así, el cálculo del MRR de esta empresa sería:

MRR= 30 x 1000

MRR= 30.000

En el caso de una empresa que tiene dos planes de suscripción, por ejemplo. Uno de ellos cuesta USD$30 y el otro USD$80. Y cada plan tiene 100 suscritos. De esa forma, el cálculo sería:

MRR = 30 x 100 + 80 x 100

MRR = 3000 + 8000

MRR = 1200

¿QUÉ ES EL ARR?

La métrica ARR, también llamada como Ingresos Anuales Recurrentes, estima el valor anual que recibirá la empresa. Para ello, se basa en el MRR, que son los ingresos mensuales. 

Cuando se calcula cada año, el ARR le permite a la empresa crear un historial y comparar los ingresos de un periodo a otro.

También permite hacer una previsión de ganancias para los próximos 12 meses. Así, puedes identificar posibles caídas y buscar soluciones a ese problema. 

Además, permite averiguar si las metas se están cumpliendo y si la empresa SaaS tiene una vida financiera saludable. 

En resumen, la diferencia entre el MRR y el ARR es que el primero hace un seguimiento del negocio mes a mes y el segundo año a año.

¿CÓMO CALCULAR LOS INGRESOS RECURRENTES ANUALES?

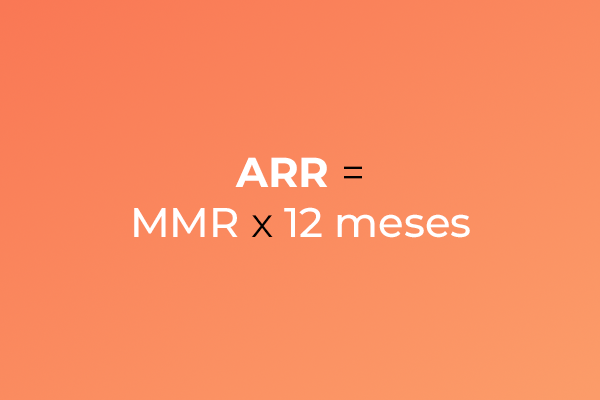
El cálculo del ARR es sencillo y rápido. Solo tienes que tomar el valor de tu MRR actual y multiplicarlo por 12 (número de meses). Así, la fórmula será:

CUÁL ES EL MRR IDEAL PARA LA EMPRESA

Solo tu empresa puede ser un parámetro de su propio MRR. Así que lo ideal es que el MRR aumente progresivamente mes a mes


Al fin y al cabo, esto sugiere que el negocio
gane más ingresos de los que pierde. De esta forma, lo más apropiado es que el MRR sea mayor que la cantidad que se pierde por la cancelación de las suscripciones. 

Cuando la tasa de cancelación es mayor que la tasa de retención de clientes, hay que ser rápido y descubrir lo que no está bien. Puede tratarse de cualquier cosa, desde un problema con la prestación del servicio hasta algo que haya afectado la imagen de la marca.

CÓMO REPERCUTE EL MRR EN EL CAC

El CAC es el coste de adquisición del cliente, es decir, cuánto ha invertido la empresa para atraer a esa persona a tu negocio. Cuando la suscripción es mensual, lo más indicado es que el valor del CAC sea inferior al de una mensualidad.

De este modo, la empresa no tendrá pérdidas por invertir más en marketing que en el retorno dado por el consumidor. Por lo tanto, es necesario tener en cuenta el tiempo promedio que las personas permanecen con la suscripción activa. 

Tomemos el ejemplo anterior en el que tu empresa ofrece un plan de suscripción y cobra USD$30 al mes por la suscripción. Tu cliente puede cancelar el servicio cuando quiera. Si el CAC es de USD$35 y el tiempo promedio de permanencia de estos nuevos clientes en el servicio es de un mes, tu empresa está teniendo pérdidas. Se está gastando más para ganar un consumidor de lo que este devuelve.

Por otro lado, si esta misma empresa tiene como promedio de permanencia en la suscripción de tres meses, un CAC de USD$35 pasa a ser aceptable, aunque podría ser mejorado. En el caso del contrato anual, este margen es mayor, ya que se asegura que durante un año el consumidor generará ganancias para el emprendimiento.

3 ESTRATEGIAS PARA AUMENTAR EL MRR Y EL IMPACTO EN EL ARR

Todas las medidas que aumentan el MRR naturalmente tienen un impacto positivo en el ARR. Aquí tienes algunas estrategias sobre cómo hacerlo. 

1 - Cuidado con las suscripciones gratuitas

Una de las formas de aumentar el MRR con cierta rapidez es empezar a cobrar la suscripción. Es un hecho que la mayoría de los nuevos productos ofrecen ese paquete gratuito, ya que ayuda a atraer a nuevos clientes e incluso a conquistarlos. Sin embargo, estas personas no suelen generar dinero directamente.

Una buena oportunidad si ofreces freemium es limitar el plazo de uso gratuito. Ofrece, por ejemplo, una semana gratis para que el cliente pruebe y, después, empieza a cobrar la cuota mensual.

2 - Ofrece un buen descuento en la suscripción anual, pero aumenta la cuota mensual

Esta es una estrategia que parece obvia, pero no lo es. Por supuesto, si subes el plan mensual, tu MRR aumentará. 

Sin embargo, si subes el paquete de pago por mes y mantienes el precio actual para los que se suscriben anualmente, acabas induciendo al cliente indeciso a elegir una suscripción anual. 

El argumento del ahorro es muy bueno para quienes cancelan el plan varias veces a lo largo del año y pueden darse cuenta de que les compensa seguir con el servicio directamente. 

Como puedes ver, esta estrategia afecta tanto al MRR como al ARR. Esto crea una estabilidad de ingresos para la empresa. 

3 - Amplía la variedad de planes

Si tu empresa tiene un plan completo y uno básico, hacer uno intermedio puede ser una buena opción.

Tranquilo, no necesitas invertir mucho en tu servicio para ofrecer nuevos planes. Confía en las soluciones white label que simplifican y reducen el coste de la innovación en tu empresa.

El cliente puede tener varias etapas dentro del proceso de compra en tu empresa. Es posible que esté en la básica y necesite más herramientas, aunque todavía no pueda comprar el paquete completo.

Si lo ayudas a migrar progresivamente, tu MRR aumentará proporcionalmente. 

¿Qué te parecieron estas estrategias? Sigue nuestro blog y aprovecha la oportunidad de probar el free trial de la plataforma white label.


Did you find this article interesting?


Thanks for the feedback!
By Shawn Davis April 1, 2026
Core Web Vitals aren't new, Google introduced them in 2020 and made them a ranking factor in 2021. But the questions keep coming, because the metrics keep changing and the stakes keep rising. Reddit's SEO communities were still debating their impact as recently as January 2026, and for good reason: most agencies still don't have a clear, repeatable way to measure, diagnose, and fix them for clients. This guide cuts through the noise. Here's what Core Web Vitals actually measure, what good scores look like today, and how to improve them—without needing a dedicated performance engineer on every project. What Core Web Vitals measure Google evaluates three user experience signals to determine whether a page feels fast, stable, and responsive: Largest Contentful Paint (LCP) measures how long it takes for the biggest visible element on a page — usually a hero image or headline — to load. Google considers anything under 2.5 seconds good. Above 4 seconds is poor. Interaction to Next Paint (INP) replaced First Input Delay (FID) in March 2024. Where FID measures the delay before a user's first click is registered, INP tracks the full responsiveness of every interaction across the page session. A good INP score is under 200 milliseconds. Cumulative Layout Shift (CLS) measures visual stability — how much page elements unexpectedly move while content loads. A score below 0.1 is good. Higher scores signal that images, ads, or embeds are pushing content around after load, which frustrates users and tanks conversions. These three metrics are a subset of Google's broader Page Experience signals, which also include HTTPS, safe browsing, and mobile usability. Core Web Vitals are the ones you can most directly control and improve. Why your clients' scores may still be poor Core Web Vitals scores vary dramatically by platform, hosting, and how a site was built. Some of the most common culprits agencies encounter: Heavy above-the-fold content . A homepage with an autoplay video, a full-width image slider, and a chat widget loading simultaneously will fail LCP every time. The browser has to resolve all of those resources before it can paint the largest element. Unstable image dimensions . When an image loads without defined width and height attributes, the browser doesn't reserve space for it. It renders the surrounding text, then jumps it down when the image appears. That jump is CLS. Third-party scripts blocking the main thread . Analytics pixels, ad tags, and live chat tools run on the browser's main thread. When they stack up, every click and tap has to wait in line — driving INP scores up. A single slow third-party script can push an otherwise clean site into "needs improvement" territory. Too many web fonts . Each font family and weight is a separate network request. A page loading four font files before rendering any text will fail LCP, especially on mobile connections. Unoptimized images . JPEGs and PNGs served at full resolution, without compression or modern formats like WebP or AVIF, add unnecessary weight to every page load. How to measure them accurately There are two types of Core Web Vitals data you should be looking at for every client: Lab data comes from tools like Google PageSpeed Insights, Lighthouse, and WebPageTest. It simulates page loads in controlled conditions. Lab data is useful for diagnosing specific issues and testing fixes before you deploy them. Field data (also called Real User Monitoring, or RUM) comes from actual users visiting the site. Google collects this through the Chrome User Experience Report (CrUX) and surfaces it in Search Console and PageSpeed Insights. Field data is what Google actually uses as a ranking signal — and it often looks worse than lab data because it reflects real-world device and connection variability. If your client's site has enough traffic, you'll see field data in Search Console under Core Web Vitals. This is your baseline. Lab data helps you understand why the scores are what they are. For clients with low traffic who don't have enough field data to appear in CrUX, you'll be working primarily with lab scores. Set that expectation early so clients understand that improvements may not immediately show up in Search Console. Practical fixes that move the needle Fix LCP: get the hero image loading first The single most effective LCP improvement is adding fetchpriority="high" to the hero image tag. This tells the browser to prioritize that resource over everything else. If you're using a background CSS image for the hero, switch it to anelement — background images aren't discoverable by the browser's preload scanner. Also check whether your hosting serves images through a CDN with caching. Edge delivery dramatically reduces the time-to-first-byte, which feeds directly into LCP. Fix CLS: define dimensions for every media element Every image, video, and ad slot on the page needs explicit width and height attributes in the HTML. If you're using responsive CSS, you can still define the aspect ratio with aspect-ratio in CSS while leaving the actual size fluid. The key is giving the browser enough information to reserve space before the asset loads. Avoid inserting content above existing content after page load. This is common with cookie banners, sticky headers that change height, and dynamically loaded ad units. If you need to show these, anchor them to fixed positions so they don't push content around. Fix INP: reduce what's competing for the main thread Audit third-party scripts and defer or remove anything that isn't essential. Tools like WebPageTest's waterfall view or Chrome DevTools Performance panel show you exactly which scripts are blocking the main thread and for how long. Load chat widgets, analytics, and ad tags asynchronously and after the page's critical path has resolved. For most clients, moving non-essential scripts to load after the DOMContentLoaded event is a meaningful INP improvement with no visible impact on the user experience. For websites with heavy JavaScript — particularly those built on frameworks with large client-side bundles — consider breaking up long tasks into smaller chunks using the browser's Scheduler API or simply splitting components so the main thread isn't locked for more than 50 milliseconds at a stretch. What platforms handle automatically One of the practical advantages of building on a platform optimized for performance is that many of these fixes are applied by default. Duda, for example, automatically serves WebP images, lazy loads below-the-fold content, minifies CSS, and uses efficient cache policies for static assets. As of May 2025, 82% of sites built on Duda pass all three Core Web Vitals metrics — the highest recorded pass rate among major website platforms. That baseline matters when you're managing dozens or hundreds of client sites. It means you're starting each project close to or at a passing score, rather than diagnosing and patching a broken foundation. How much do Core Web Vitals actually affect rankings? Honestly, they're a tiebreaker — not a primary signal. Google has been clear that content quality and relevance still dominate ranking decisions. A well-optimized site with thin, irrelevant content won't outrank a content-rich competitor just because its CLS is 0.05. What Core Web Vitals do affect is the user experience that supports those rankings. Pages with poor LCP scores have measurably higher bounce rates. Sites with high CLS lose users mid-session. Those behavioral signals — time on page, return visits, conversions — are things search engines can observe and incorporate. The practical argument for fixing Core Web Vitals isn't just "because Google said so." It's that faster, more stable pages convert better. Every second of LCP improvement can reduce bounce rates by 15–20% depending on the industry and device mix. For client sites that monetize through leads or eCommerce, that's a revenue argument, not just an SEO argument. A repeatable process for agencies Audit every new site before launch. Run PageSpeed Insights and record LCP, INP, and CLS scores for both mobile and desktop. Flag anything in the "needs improvement" or "poor" range before the client sees the live site. Check Search Console monthly for existing clients. The Core Web Vitals report surfaces issues as they appear in field data. Catching a regression early — before it compounds — is significantly easier than explaining a traffic drop after the fact. Document what you've improved. Clients rarely see Core Web Vitals scores on their own. A monthly one-page performance summary showing before/after scores builds credibility and makes your technical work visible. Prioritize mobile. Google uses mobile-first indexing, and field data shows that mobile CWV scores are almost always worse than desktop. If you only have time to optimize one version, do mobile first. Core Web Vitals aren't a one-time fix. Platforms change, new scripts get added, campaigns bring in new widgets. Build the audit into your workflow and treat it like any other ongoing deliverable, and you'll stay ahead of the issues before they affect your clients' rankings. Duda's platform is built with Core Web Vitals performance in mind. Explore how it handles image optimization, script management, and site speed automatically — so your team spends less time debugging and more time building.
By Ilana Brudo March 31, 2026
Vertical SaaS must transition from tools to an AI-powered Vertical Operating System (vOS). Learn to leverage context, end tech sprawl, and maximize retention.
By Shawn Davis March 27, 2026
Automate client management, instant site generation, and data synchronization with an API-driven website builder to create a scalable growth engine for your SaaS platform.
Show More

Latest posts