If you are building
eCommerce websites for your clients, you want to make sure they keep track of their store performance.
It’s valuable insights your clients can take advantage of.
But much better than that…
You can use these eCommerce metrics to sell additional services!
From optimizations to digital marketing.
With eCommerce metrics, you can understand the performance of your clients’ websites, help them scale, and offer solutions catered to their specific needs.
It’s really a must-have!
That’s why we’ve compiled a list of all the most important eCommerce key performance indicators (KPIs) you need to track.
Let’s jump right into it!
What is a Key Performance Indicator (KPI)?
A key performance indicator (KPI) is a quantifiable measure of performance over time for a specific objective. In other words, it’s the data you should analyze to see if a business performs as it should.
KPIs are a bit different from OKRs (Objectives and Key Results), which are more of a goal-setting method to improve performance. KPIs on the other hand are the metrics showing the actual performance.
You can, for example, analyze a few KPIs to come up with an OKR.
KPIs can be:
1. Amount of money:
- Total revenue
- Total cost
- Average amount spent
- Return on investment
- Cost of goods sold (COGS)
- Customer acquisition cost (CAC)
- Return on ad spend (ROAS)
- Net profit
- Cost per click (CPC).
2. Rates:
- Click-through rate (CTR)
- Churn rate
- Customer retention rate.
3. Quantitative values:
- Total number of customers
- Total number of visitors
- Number of orders
- Number of conversions
- Net promoter score (NPS)
- Number of new customers.
What is a KPI in eCommerce?
A KPI in eCommerce is an important metric that lets you know if an online store is on track to attain its business goals.
There can be multiple different types of KPIs to track for an eCommerce store;
- Digital marketing strategy KPIs: ad campaigns spending, CTR, and conversions
- Search engine optimization (SEO) KPIs: organic search traffic, rankings, and conversions
- Social media KPIs: social media engagement, organic posts performance
- Website performance KPIs: Traffic, bounce rate
- Email marketing KPIs: email list, unsubscribes, open rate
- Business KPIs: total revenue, return on investment
A good eCommerce report will include some KPIs from each category, depending on the company goals, but will mostly focus on business and website performance metrics.
Why Are KPIs Important?
KPIs are crucial to determine if your client’s eCommerce store is on track to attain its objectives.
By tracking the right KPIs you can
improve customer experience (UX), digital marketing campaigns, and more. All helping your client’s online business get the best possible bottom line.
Even better yet, as an agency, showing off your client’s eCommerce website performance can help you justify and sell your services, whether it’s website creation, SEO, social media campaigns, ad campaigns, or digital marketing.
You can not only show off your good results, but also
upsell them or cross-sell on other services you may be offering so that their business can truly scale.
For example, if you have a client who you just built a website for, you can show them that their social media strategy, or search engine optimization needs some improvement, and casually mention that your agency offers these services as well.
How to Decide Which KPIs to Track?
You should determine which KPIs to track
according to your clients goals. If, for example, they want to improve their eCommerce store checkout process, it’s important to track KPIs such as cart abandonment rate or number of completed orders, so that you can make sure your efforts are paying off.
If what they want is to improve their website traffic, then you should track SEO KPIs, number of visitors, and landing page performance for example.
Note: Make sure not to track vanity metrics.
Vanity metrics are
metrics that aren’t related to your client’s objectives and that most people track because they
seem important. It could for example be their social media followers when they aren’t not working on social media strategies. Tracking this data will only add noise to your report, it can also make your clients more confused as to what worked out or not, and may give them a false impression of their eCommerce store performance.
10 Most Important KPIs And Metrics to Track For an eCommerce Site
There are hundreds if not thousands of KPIs out there, from website engagement metrics, to social media data, that you could track for your client’s eCommerce website, but only a few are relevant to most eCommerce stores.
Here are the most important KPIs you should track.
1. Conversion Rate
One of the most important metrics when it comes to eCommerce is the conversion rate.
How many of the website visitors end up converting into clients? This KPI will help determine the quality of the traffic, if promotions, campaigns and UX are working as they should.
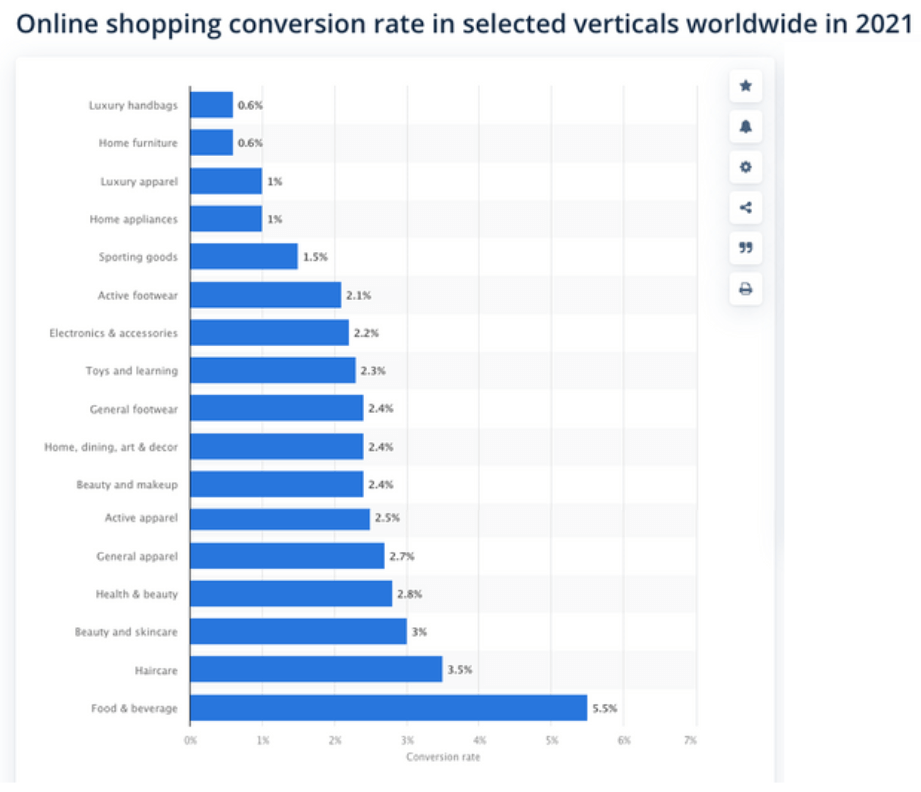
Analyzing this data alongside
industry benchmarks
will help get a clear view of how an eCommerce store performs, since the conversion rate from one industry to another can be far from the same. For example, home furniture e-stores have an average conversion rate of about 0.6% whereas food and beverages websites can be as good as 5.5% on average. So make sure the benchmarks are adapted to each client.
Conversion rate formula:
Conversion Rate = (Total Number of Visitors on the Website / Total Number of Conversions) x 100
2. Customer Acquisition Cost (CAC)
The customer acquisition cost (CAC) is how much it costs your clients to acquire a new customer.
These costs can be from digital marketing, ad campaigns, or other acquisition strategies. As a general rule; the lower the CAC, the better. It’s important to track this KPI in order to make sure you don’t spend more on acquiring customers than what they actually pay.
Therefore, it’s always good to compare this KPI with the average order value (AOV) and Customer lifetime value (CLV).
Customer acquisition cost (CAC) formula:
CAC = Costs Spent on Acquiring Customers / Number of Customers Acquired
3. Average Order Value (AOV)
The average order value (AOV) is how much your customers spend on average for each order they place. This KPI may help adjust pricing, promotions or product offering to make customers spend more on average.
Average order value (AOV) formula:
AOV = Total Revenue / Number of orders.
4. Customer Lifetime Value (CLV)
The customer lifetime value (CLV) is how much an average customer will spend with a company, therefore how much value they will bring to the business in their lifetime. You can calculate it like so:
Customer’s Annual Profit Contribution x Average Number of Year as Customer – the Initial Cost of Customer Acquisition
So for example if your client sells mostly to students who will spend on average $1000 per year on their website, that it costs $500 in CAC and that they usually stay clients for about 3 years, then their CLV is $2500.
The best case scenario for most eCommerce stores is to have repeat customers who come back after a period of time to buy again and again. Repeat purchase makes each new customer a lot more valuable. Ways to increase the CLV can be to increase the customer retention rate, invest in customer loyalty programs, and in customer satisfaction.
Customer lifetime value (CLV) formula:
CLV = (Customer’s Annual Profit Contribution x Average Number of Year as Customer) – the Initial Cost of Customer Acquisition
5. Shopping Cart Abandonment Rate (CAR)
The
shopping cart abandonment rate is the proportion of customers who will fill up their shopping carts with items but never checkout.
Once you’ve invested so much time and resources into bringing qualified traffic to your website, one of the most frustrating scenarios is always the abandoned shopping cart. The sale was
this close.
The lower the shopping cart abandonment rate is, the better. An increase in this metric should result in investing resources into finding out why and coming up with a solution. Maybe the payment methods are not appropriate for the audience? Are there bugs or UX problems when it comes to the checkout? Make sure to find out!
Shopping cart abandonment rate formula:
CAR = 1 – (Total Number of Completed Transactions / Total Number of Shopping Carts) x 100
6. Checkout Abandonment Rate
In the same vein, it’s also important to track the checkout abandonment rate. This is the proportion of customers who will engage in the checkout process without finishing it. Typically, this metric will show if the checkout process has issues or should be improved. It’s important to track this KPI closely to keep it as low as possible.
Checkout abandonment rate formula:
Checkout abandonment rate = 1 – (Number of orders completed / Number of checkouts initiated) x 100
7. Bounce Rate
The bounce rate is the proportion of people who landed on a website but didn’t visit other pages before leaving. A higher bounce rate can indicate a number of things: Bad ad targeting, slow page speed, bad UX, or simply that the page in question isn’t optimized for conversions (e.g.: an informative blog post).
Bounce rate formula:
Bounce Rate = Total Number of One-page Visits / Total Number of Entries to a Website
8. Refund/Return Rate (RR)
Refunds are when customers ask for their money back, either because the product did not fit, was defective or that they simply did not want it anymore. It’s usually accompanied by a return of the product.
A high refund and return rate, means that something is going on that should definitely be improved. It’s important to track your client’s refunds and returns so that if a particular product is returned more than usual, you can act on it and make sure the problem gets solved. Maybe the product is mislabeled or the product page is confusing (wrong sizes, not enough photos or descriptions).
Refund/Return rate formula:
RR = [(Current Value – Original Value) / Original Value] x 100
9. Gross Merchandise Value
The Gross merchandise value is the total sales monetary-value for merchandise sold through a particular online marketplace over a certain time frame. This metric can be useful to track trends over time periods.
Gross merchandise value formula:
GMV = Sales Price of Goods x Number of Goods Sold.
10. Gross Profit Margin
The gross profit margin shows the percentage of revenue that exceeds the cost of goods sold (COGS). In other words, it shows the amount of profit you make after subtracting the costs of production and distribution.
Gross profit margin formula:
Gross Profit Margin = (Net Sales − COGS) / Net sales
Get Started With the Best Performing eCommerce Website Builder
Now that you know exactly how to track your clients’ eCommerce performance, make sure the website builder you use enables you to create the best performing sites from the get-go.
All Duda stores are designed for agencies to maximize their customer conversion with industry-leading features such as:
- Superior SEO
- The fastest loading homepage
- A mobile-friendly experience
- Coupons & gift cards
- Abandoned cart emails
- Delivery & pickup scheduler
- 40+ payment providers
- And so much more…
On top of that, it’s a white-label solution you can pass as your own powerful builder! What more can you ask for?